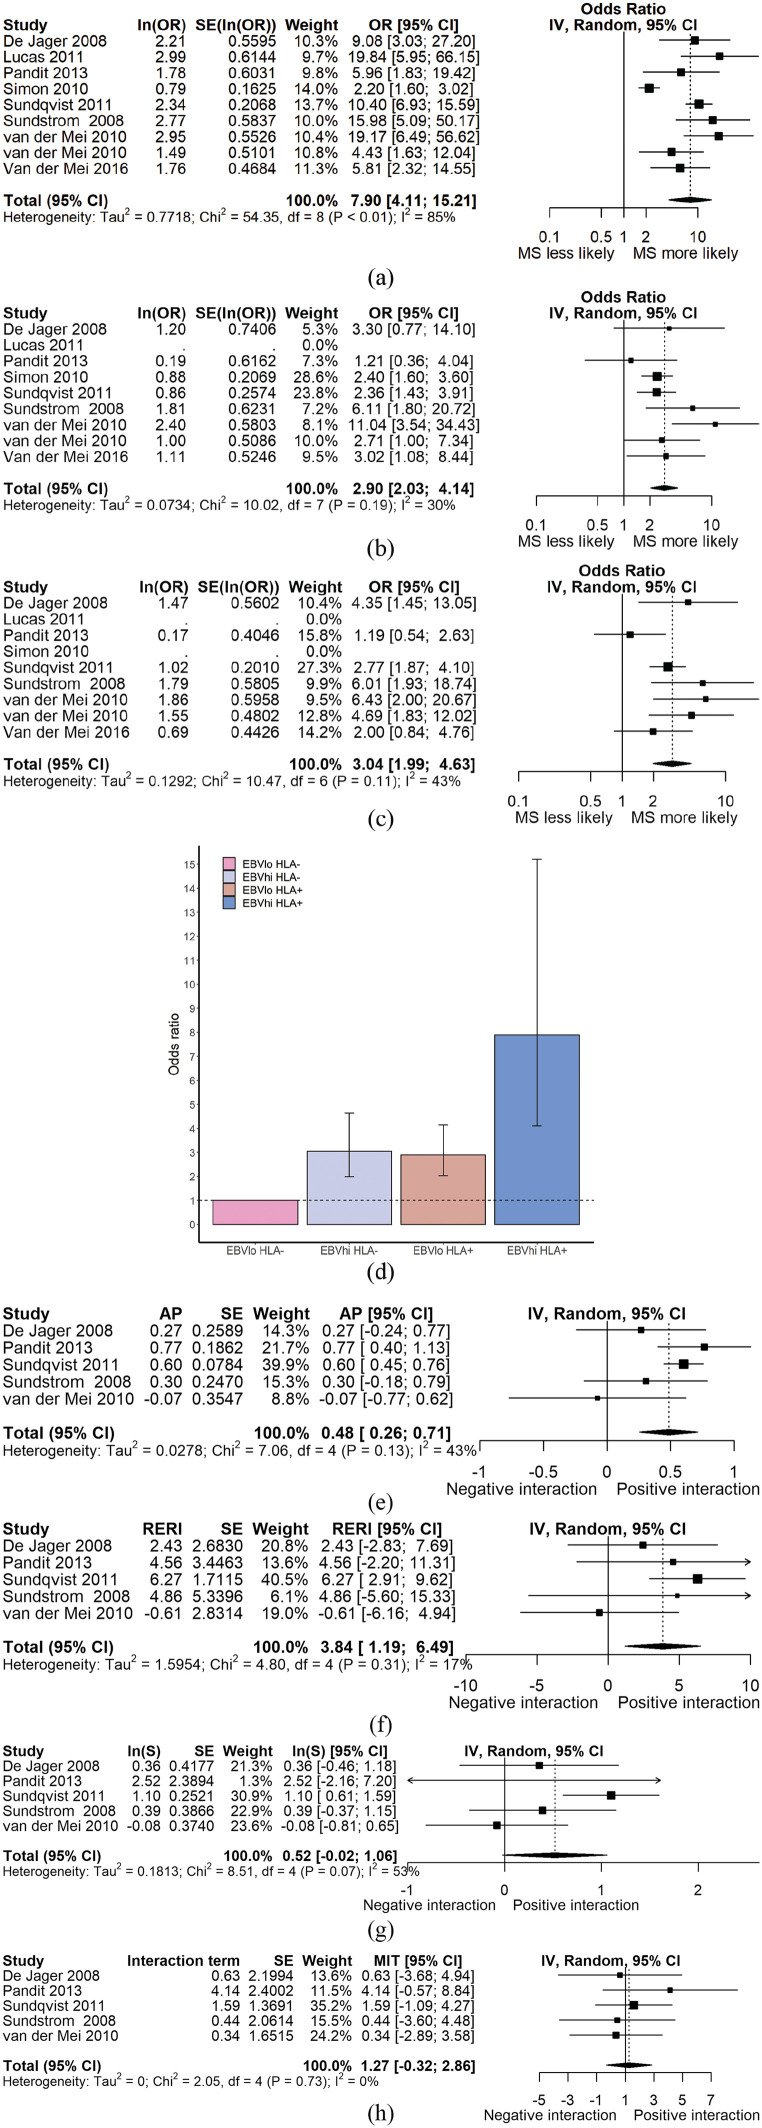
Figure 2.
(a) Forest plot demonstrating ORMS for HLA+EBNAhi persons. (b) Forest plot demonstrating ORMS for HLA+EBNAlo persons. (c) Forest plot demonstrating ORMS for HLA–EBNAhi persons. (d) Bar chart demonstrating evidence of interaction between HLA-DRB1*1501 genotype and EBNA antibody titre on an additive, but not multiplicative scale. The dotted line represents the null (OR = 1). (e)–(h) Forest plots demonstrating estimates of interaction – AP, RERI, synergy index, and multiplicative interaction respectively – for studies with individual-level data available. The reference group (with OR = 1) is HLA–EBNAlo individuals for all panels. MIT: multiplicative interaction term.

