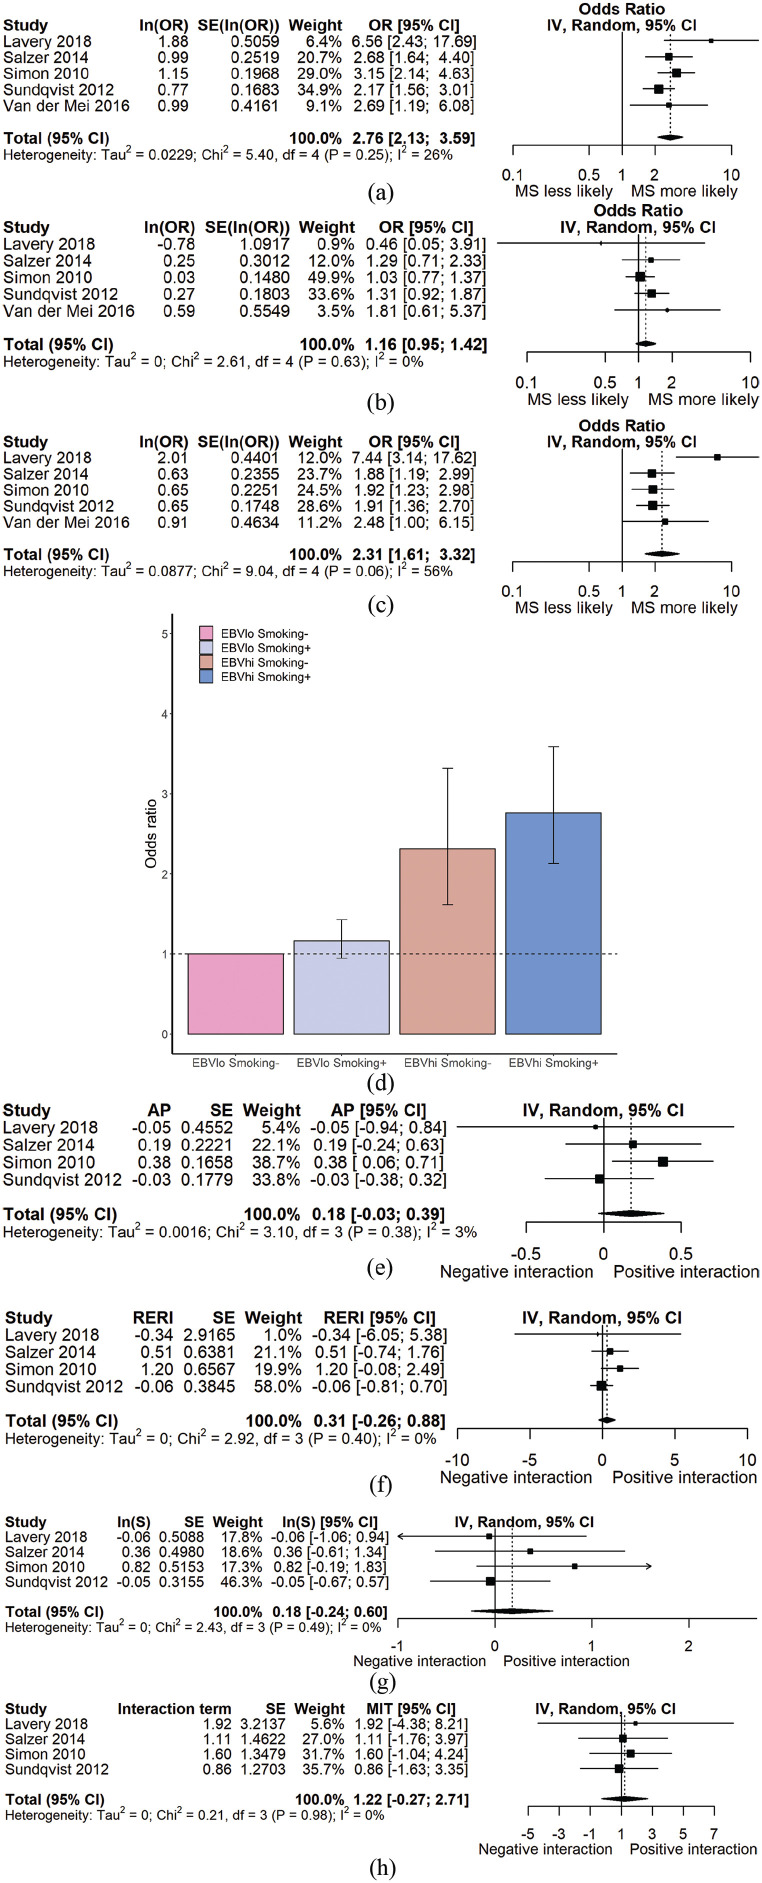
Figure 4.
(a) Forest plot demonstrating ORMS for EBNAhiSmoking+ persons. (b) Forest plot demonstrating ORMS for EBNAloSmoking+ persons. (c) Forest plot demonstrating ORMS for EBNAhiSmoking– persons. (d) Bar chart demonstrating lack of evidence of interaction between smoking status and EBNA titre on an additive, but not multiplicative scale. (e)–(h) Forest plots demonstrating estimates of interaction – AP, RERI, synergy index, and multiplicative interaction respectively – for studies with individual-level data available. The reference group (with OR = 1) is EBNAloSmoking– individuals for all panels. MIT: multiplicative interaction term.

