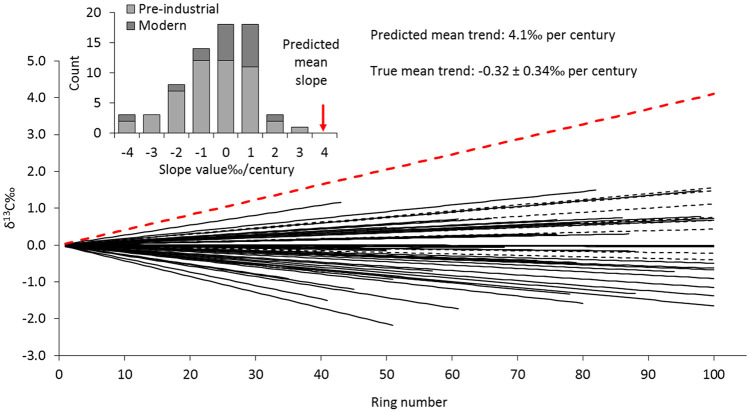
Figure 1.
Linear trends of carbon isotope ratio plotted against ring number for 18 modern oak trees (dashed black lines) and 50 pre-industrial oak timbers (solid black lines) compared with the mean trend predicted by Brienen et al. (2017) (dashed red line). Inset shows the distribution of slope values.

