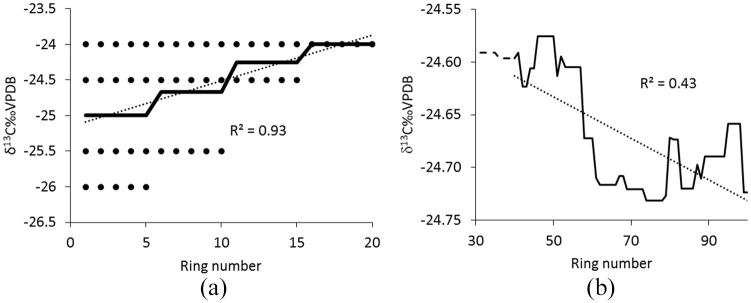
Figure 2.
Simple illustration (a) of how spurious trends are produced when averaging the isotopic values of four series that are completely flat (black dots) but are offset and of different length. When the pre-industrial series used in this study are replaced by their mean values, so that all 50 series have zero trend and zero variance, the average shows a strong but completely spurious trend (b).

