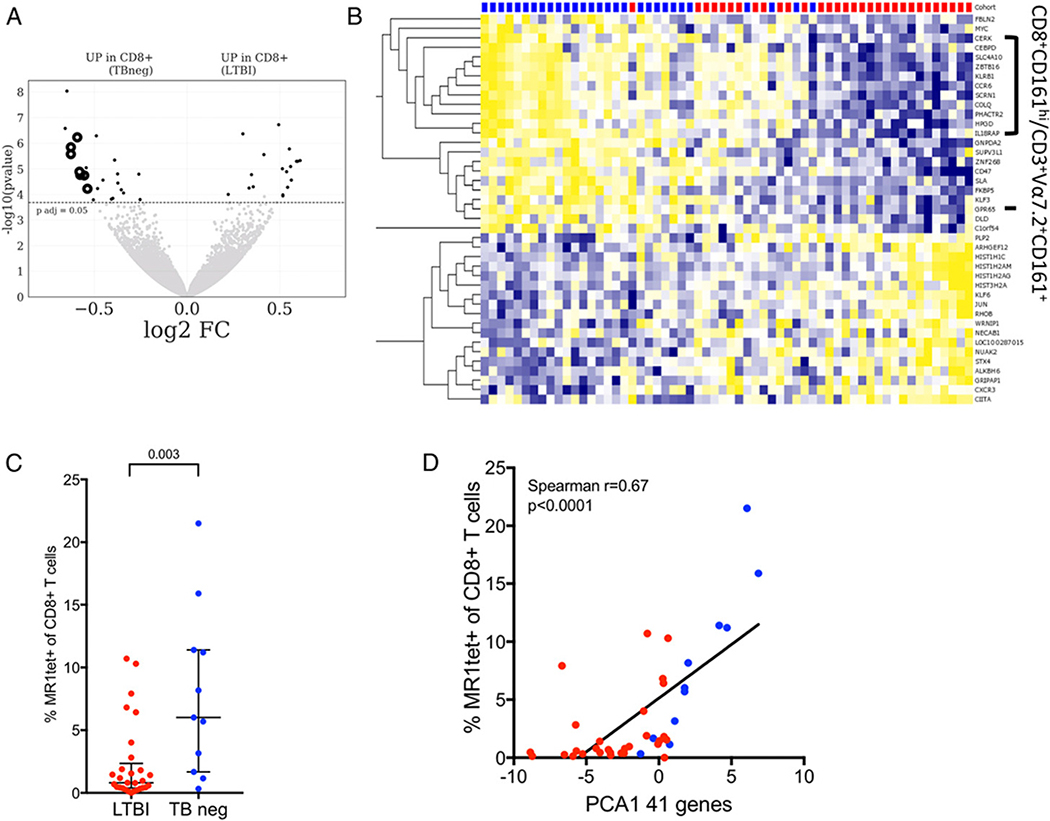
FIGURE 1. Transcriptomic profile of memory CD8 T cells comparing LTBI subjects with TB neg controls reveal changes in MAIT frequency.
(A) Volcano plot obtained from the DEseq2 analysis showing log2 fold change versus −log10 p value. The 41 differentially expressed genes are represented in black (adjusted p value <0.05 indicated by dotted line). Known genes expressed by CD8+Vα7.2+CD161+ T cells are shown in black circles. Genes upregulated in TB neg controls (left) and genes upregulated in LTBI (right). (B) Heatmap displaying regularized logarithm–transformed raw counts of the 41 differentially expressed genes from (A), genes are ordered by hierarchical clustering, and subjects are ordered by principal component 1 (PC1). TB neg (blue), LTBI (red). (C) Frequency of MR1tet+ of CD8+ T cells as measured by flow cytometry LTBI (n = 29), TB neg (n = 11). Two-tailed Mann–Whitney U test. Median ± interquartile range is indicated. (D) Correlation between the PC1 of the combined expression of the 41 differentially expressed genes, identified in (A), and the frequency of MR1tet+ of CD8+ T cells in corresponding subjects. Correlation is indicated by Spearman r and associated two-tailed p value.

