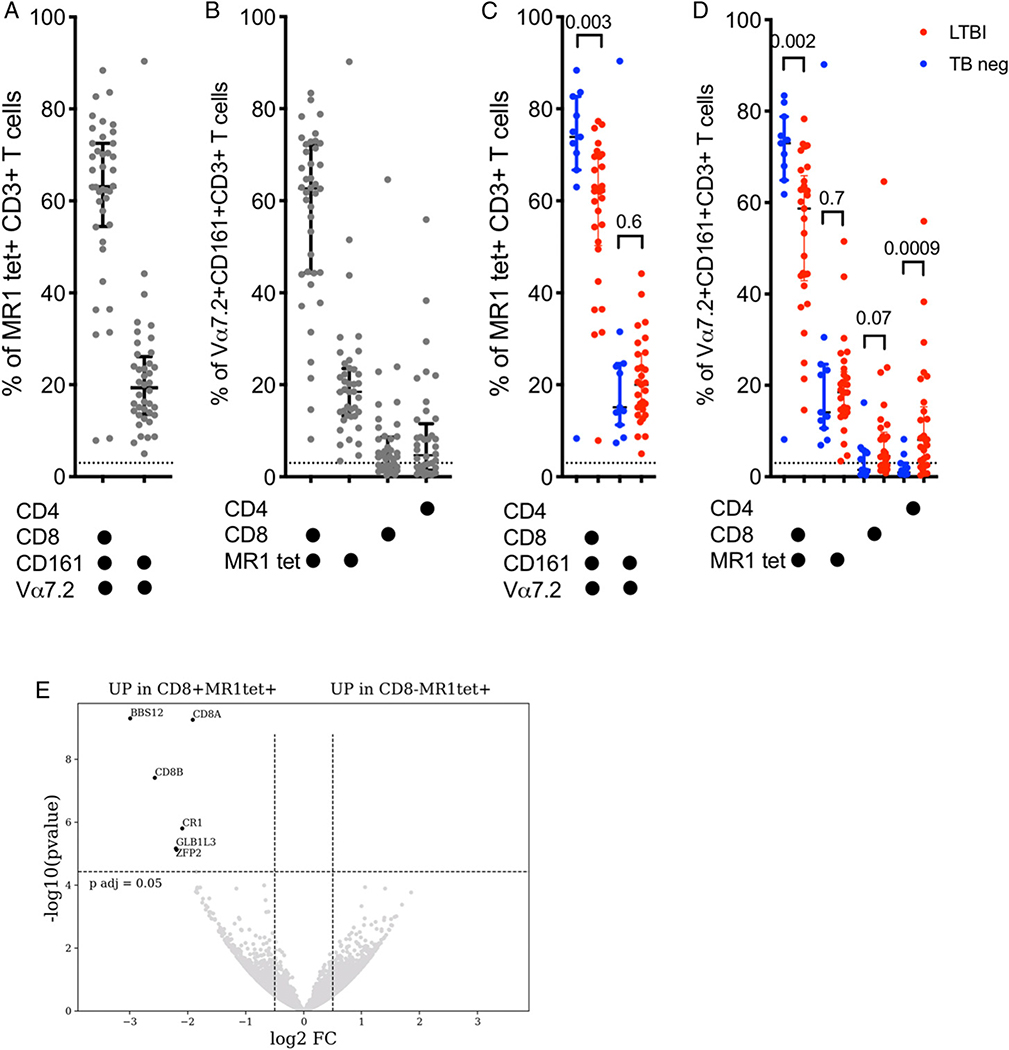
FIGURE 3. Phenotypic and transcriptomic profiling of MAITs reveals four distinct subsets and overlapping gene expression programs between CD8+ MR1tet+ and CD8− MR1tet+ cells.
(A) Percentage of the two dominant MR1 tetramer+ CD3+ T cell subsets expressing combinations of CD4, CD8, CD161, and/or Vα7.2 with a median expression above 3%. Each dot represents one subject (n = 40; 11 TB neg and 29 LTBI). Median ± interquartile range is indicated. Dotted line indicates arbitrary cut-off for median expression at 3%. (B) Percentage of the four dominant Vα7.2+CD161+CD3+ T cell subsets expressing or binding combinations of CD4, CD8, and MR1 tetramer with a median expression above 3%. Each dot represents one subject (n = 40; 11 TB neg and 29 LTBI). Median ± interquartile range is indicated. Dotted line indicates arbitrary cut-off for median expression at 3%. (C) Percentage of the two dominant MR1 tetramer+ CD3+ T cell subsets expressing combinations of CD4, CD8, CD161, and/or Vα7.2 with a median expression above 3% in 11 TB neg (blue) and 29 LTBI (red) individuals. Each dot represents one subject. Median ± interquartile range is indicated. Dotted line indicates arbitrary cut-off for median expression at 3%. Two-tailed Mann–Whitney U test. (D) Percentage of the four dominant Vα7.2+CD161+CD3+ T cell subsets expressing or binding combinations of CD4, CD8, and MR1 tetramer with a median expression above 3% in 11 TB neg (blue) and 29 LTBI (red) individuals. Each dot represents one subject. Median ± interquartile range is indicated. Dotted line indicates arbitrary cut-off for median expression at 3%. Two-tailed Mann–Whitney U test. (E) Volcano plot obtained from the DEseq2 analysis showing log2 fold change versus −log10 p value. The six differentially expressed genes are represented in black (adjusted p value <0.05 and absolute log2 fold change >1 are indicated by dotted lines). Genes upregulated in CD8+ MR1tet+ cells (left) and genes upregulated in CD8− MR1tet+ cells (right).

