
FIGURE 3.
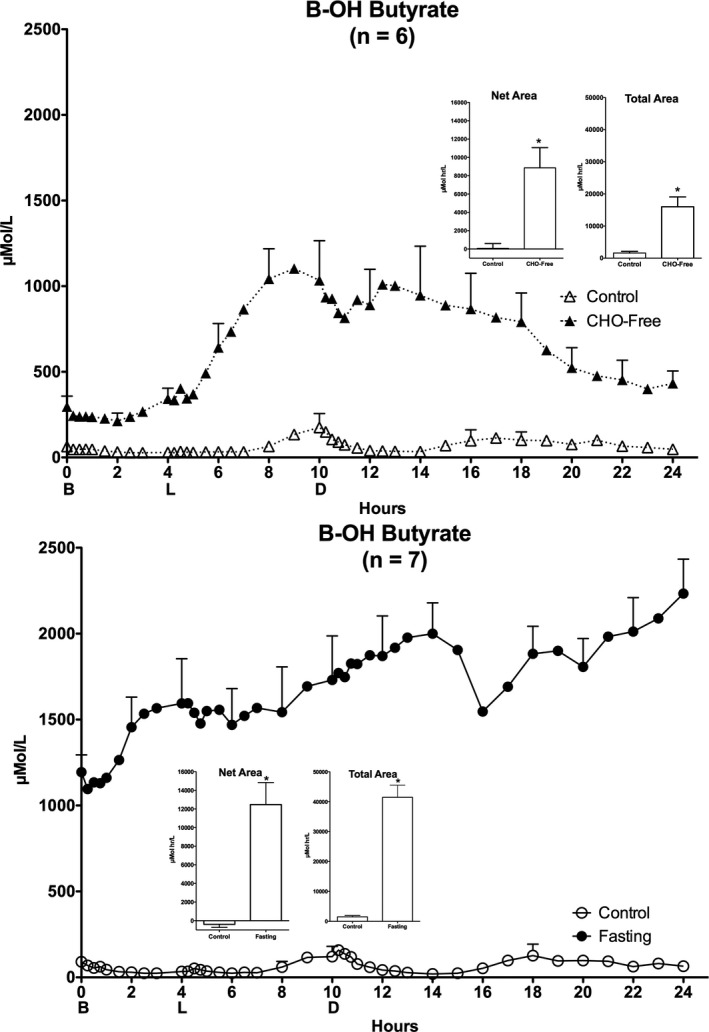
Plasma β‐Hydroxybutyrate (bHB). Twenty‐four hour bHB responses. Top: (n = 6) Mean ± standard error of the mean (SEM) while ingesting the control diet (open triangles) and for the last 24 hr (hours 48–72) of ingesting CHO‐free diet (closed triangles). Bottom: (n = 7) Mean ± SEM while ingesting the control diet (open circles) and the last 24 hr (hours 48–72) of fasting (closed circles). X‐axis: Time in hours. 0 = 0800 hr. B, L, D indicate breakfast, lunch and dinner mealtimes. Y axis Left, concentration in Scientific Units. Inserts: Net Area represents the mean ± SEM integrated 24‐hr area response, using the overnight fasting concentration as baseline. Total Area represents the mean ± SEM integrated 24‐hr area response, using zero as baseline. S = Standard mixed diet (control), C = CHO‐free diet, F = Fasting. Statistics were done using Student's t test for paired variates. *p < .05