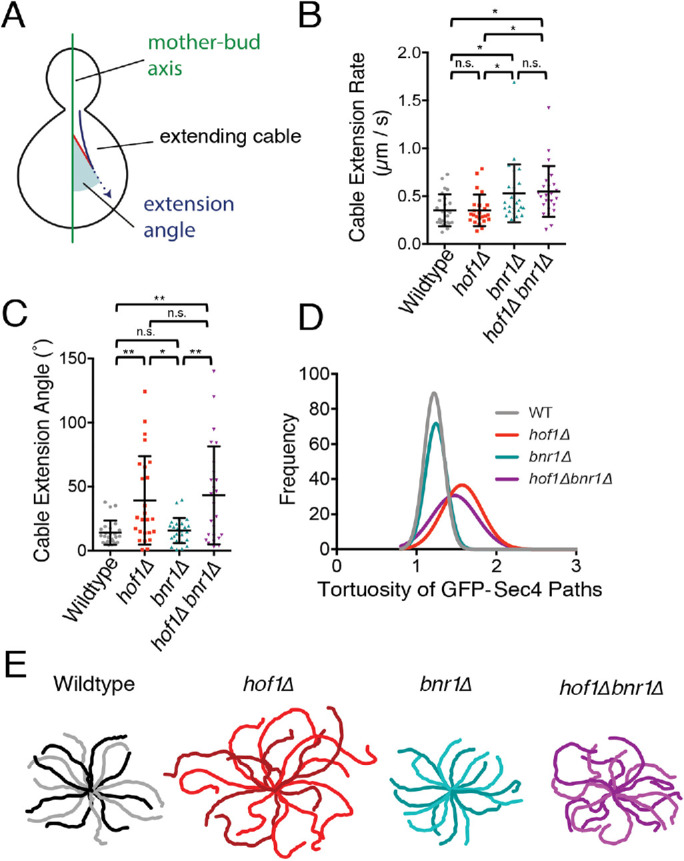
FIGURE 2:

Live imaging of actin cable extension angles and secretory vesicle movements reveals defects in hof1∆ and hof1∆ bnr1∆ cells. Diagram of aspects of cable dynamics analyzed. Extending cables (blue arrow) and extension angles (shaded in red) corresponding to angles of cable extension relative to the mother–bud axis. (B) Extension rates of Abp140-3GFP marked actin cables measured in custom software written in MATLAB (n = 25 cables per strain). Error bars, SD. Statistical significance calculated by one-way ANOVA (n.s., no significance; p > 0.05; *, p ≤ 0.05; **, p ≤ 0.01; ***, p ≤ 0.001; ****, p ≤ 0.0001). (C) Extension angles of same actin cables as in B measured in custom MATLAB software (n = 25 cables per strain). Error bars, SD. Statistical significance calculated by one-way ANOVA (n.s., no significance; p > 0.05; *, p ≤ 0.05; **, p ≤ 0.01; ***, p ≤ 0.001; ****, p ≤ 0.0001). (D) Frequency distributions of the tortuosity (ratio of length to distance) of GFP-Sec4 paths observed in each indicated strain (n = 150 vesicles per strain). (E) Representative traces of GFP-Sec4 paths observed in the indicated strains. In each case, the outer tips of each trace represent the beginning of the vesicle path and the center of the traces represents the bud neck.
