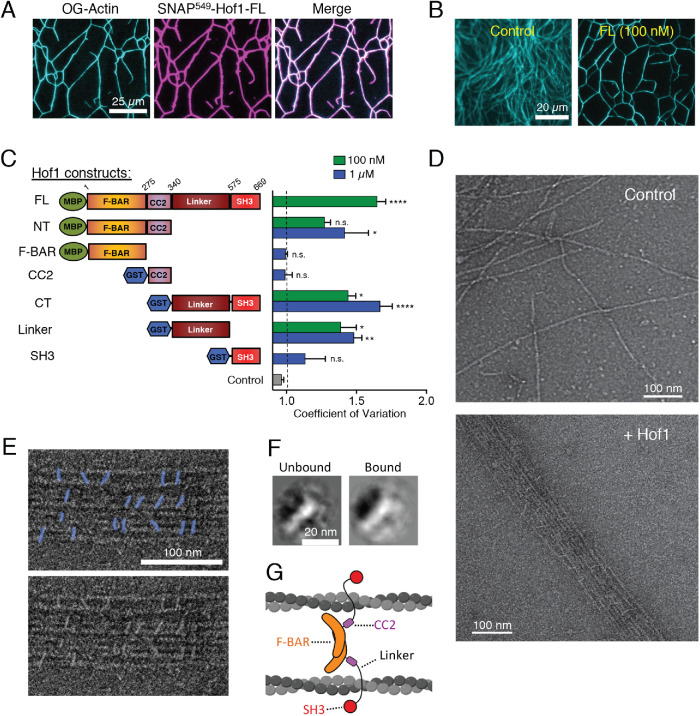
FIGURE 3:
Purified Hof1 bundles F-actin. (A) Representative image of TIRF microscopy assay in which 2 µM actin (10% Oregon-green labeled) was allowed to polymerize and then 100 nM SNAP549-Hof1-FL was flowed in. SNAP-labeled Hof1 bundles actin filaments. Scale bar, 25 µm. (B) Representative images of TIRF microscopy assays in which 2 µM actin (10% Oregon-green labeled) was polymerized and then buffer or 100 nM Hof1-FL was flowed into the TIRF chamber. Scale bar, 20 µm. (C) Diagram of Hof1 constructs tested in TIRF assays as in B and CoV measurements for 100 nM (green) and/or 1 µM (blue) of each. Data averaged from three FOVs in each of two independent experiments. Error bars, SEM. Statistical significance compared with control (gray bar) calculated by one-way ANOVA (n.s., no significance; p > 0.05; *, p ≤ 0.05; **, p ≤ 0.01; ***, p ≤ 0.001; ****, p ≤ 0.0001). (D) Representative EM images of negatively stained actin filaments. Top, actin filaments alone (no Hof1). Bottom, actin filaments and 500 nM Hof1-FL. Scale bars, 100 nm. (E) Top, higher magnification view of EM as in D with Hof1-FL (colored in blue) decorating actin filaments. Bottom, original uncolored EM image. (F) Class averages of Hof1 particles imaged by EM. Left, class average of free Hof1 particles (not bound to actin filaments). Right, class average of particles bound to actin filaments. Both class averages have a crescent-shaped structure as expected for F-BAR proteins. Scale bar, 20 nm. (G) Model for Hof1 dimer binding to and bundling actin filaments (created with Biorender.com).

