FIGURE 5:
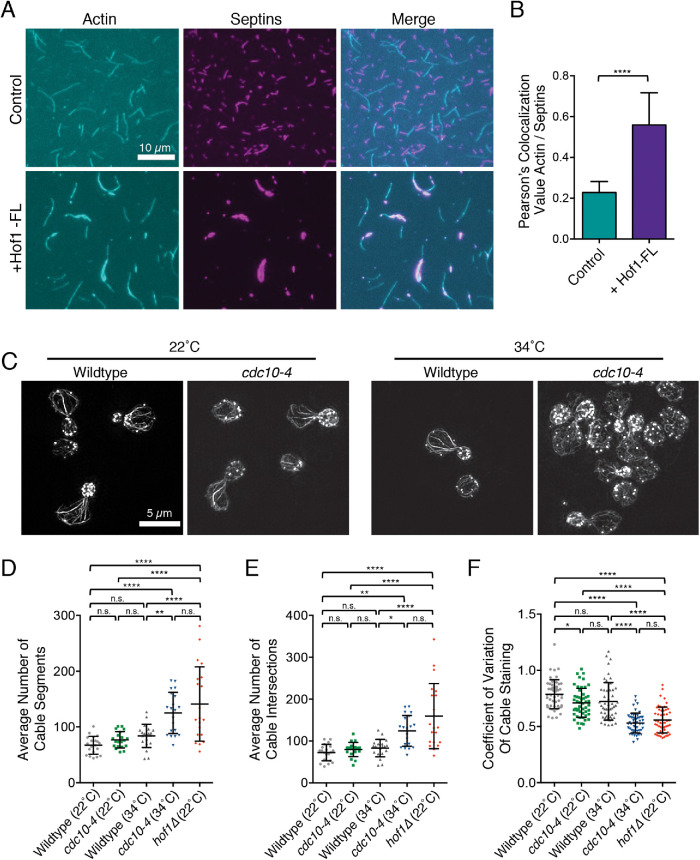
Hof1 physically links septins and actin filaments in vitro. (A) Representative images from TIRF microscopy assays showing Hof1-FL physically links actin and septin filaments in vitro. All reactions contain 1 µM actin (10% Oregon-green labeled) and 50 nM labeled SNAP549-septin rods. Images show representative fields of view 200 s after initiation of actin and septin assembly in control reactions without Hof1 (top row) or reactions with 50 nM Hof1-FL (bottom row). Scale bar, 10 µm. (B) Pearson’s colocalization analysis of actin and septin filaments from TIRF microscopy assays in A in the presence and absence of Hof1-FL. Data averaged from four FOVs in each of three independent experiments. Error bars, SD. Statistical significance calculated by unpaired t test (****, p ≤ 0.0001). (C) Representative SIM images of actin organization in fixed and phalloidin-stained wild-type and temperature-sensitive septin mutants, cdc10-4, at 22°C and 34°C. Scale bar, 5 µm. (D) Average number of cable segments per cell analyzed by SOAX, quantified for 20 cells per strain. (E) Average number of cable intersections per cell analyzed by SOAX, quantified for the same 20 cells per strain. (F) CoV measurements of phalloidin staining in mother cells after 100 µM CK666 treatment averaged from 50 cells per strain. Error bars (SD) in all panels. Statistical significance in panels D–F calculated by one-way ANOVA (n.s., no significance; p > 0.05; *, p ≤ 0.05; **, p ≤ 0.01; ***, p ≤ 0.001; ****, p ≤ 0.0001).

