FIGURE 2:
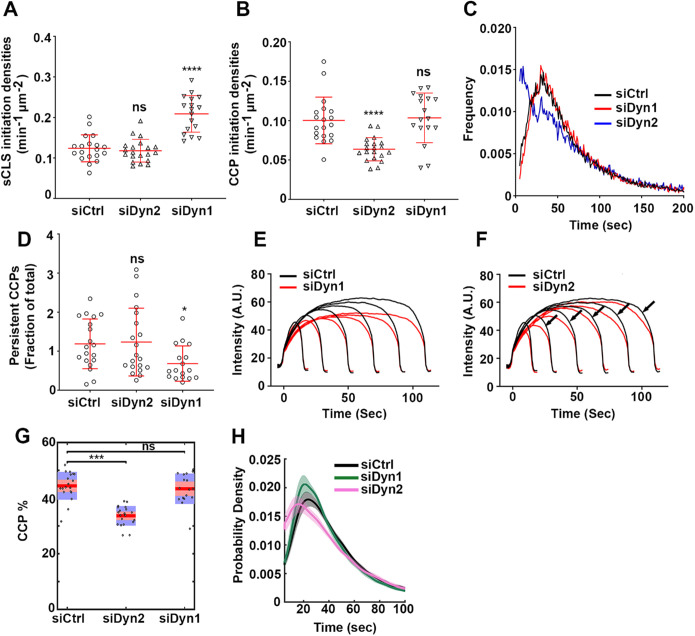
Differential regulation of CCP dynamics by dynamin isoforms. ARPE mRuby-CLCa live cell TIRFM data were analyzed by cmeAnalysis (A–F) or an intensity threshold independent DASC analysis algorithm (G, H). (A–D) Effect of dynamin isoform KD on (A) the rate of initiation of the subthreshold CSs. (B) The rate of initiation of CCPs above threshold. (C) The lifetime distribution of CCPs analyzed by cmeAnalysis, and (D) the proportion of the persistent CCPs; t test was used to calculate the statistical significance of cmeAnalysis data. (E, F) Intensity profiles of lifetime cohorts of mRuby-CLCa in (E) siCtrl vs. siDyn1 cells and (F) siCtrl vs. siDyn2 cells (G) Change in the percentage of CCPs calculated from DASC analysis. Dots represent raw data points from individual movies, box plots show mean as a red line with 95%, and 1 SD as pink and blue blocks, respectively. Wilcoxon rank-sum test was used to calculate the statistical significance of changes in CCP%. (H) Lifetime distribution of CCPs is defined by DASC analysis (number of traces analyzed by cmeAnalysis for siCtrl: 59682; siDyn1:51084; siDyn2: 34284; number of traces analyzed by DASC for siCtrl: 142050; siDyn1: 162768; siDyn2:102856). Data shown are representative of three independent biological repeats.

