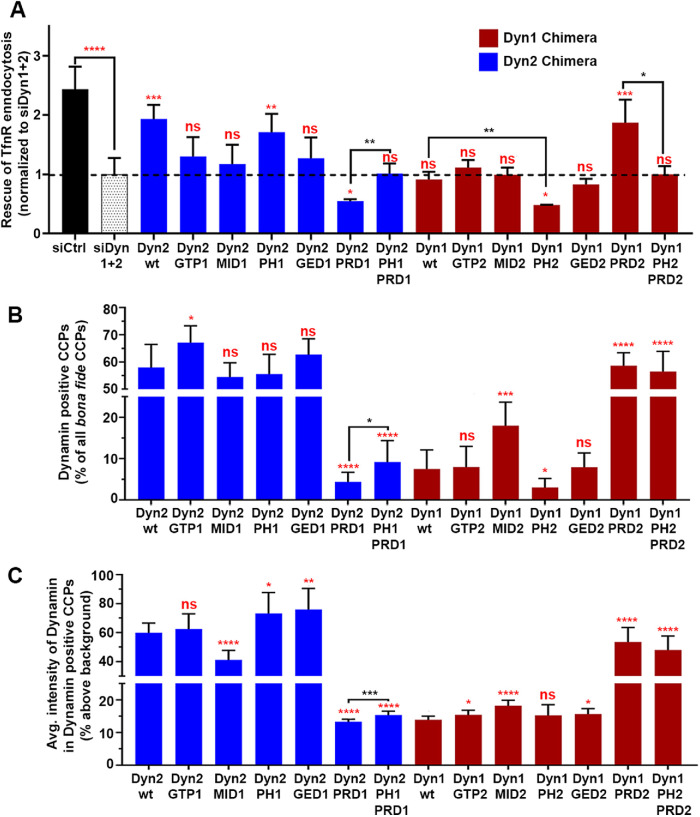
FIGURE 3:
Domain swap chimeras reveal important functional differences between dynamin isoforms. (A) The ability of dynamin chimera to rescue TfnR uptake in the absence of endogenous Dyn1 and Dyn2 compared with residual TfnR uptake in Dyn1+2 double KD cells (indicated by the dashed line). Red asterisks indicate statistical significance of CME rescue by dynamin chimera when compared with residual CME in Dyn1+2 double KD cells; black asterisks denote statistical significance of CME rescue by dynamin chimera when compared with each other. Data shown are average ± SD (n = 3 independent biological repeats). (B) Quantification of the percentage of Dyn-positive CCPs from dual-color TIRFM images of mRuby-CLCa cells expressing eGFP fusions of dynamin domain swap chimera in the absence of endogenous Dyn1 and Dyn2. (C) Quantification of average Dyn-eGFP intensity in Dyn-positive CCPs from dual-channel TIRF images in the absence of endogenous Dyn1 and Dyn2. The number of CCPs analyzed in B and C is 18,000 CCPs from 40–50 cells/condition in single imaging experiment. For B and C, red asterisks indicate statistical significance when Dyn1 and Dyn2 chimera are compared with their respective wild-type controls. Black asterisks are used when two chimeras are compared with each other. Error bars represent SD; t test was used to analyze statistical significance.

