FIGURE 2:
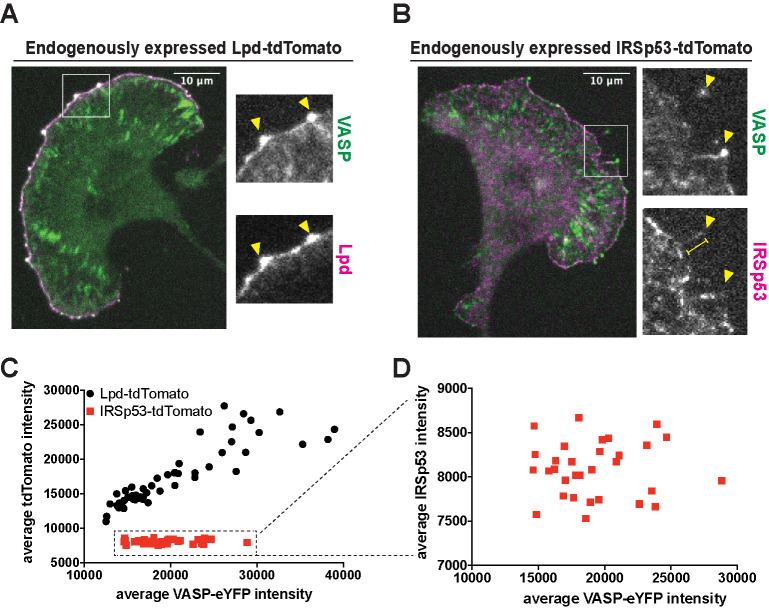
Differential localization of the VASP binding partners, lamellipodin (Lpd) and IRSp53, at the leading edge. (A) Representative image of monoclonal, endogenously expressed VASP-eYFP and Lpd-tdTomato B16F1 cell line shows strong colocalization of the two proteins at VASP foci. Arrowheads: VASP-eYFP foci. (B) Representative image of monoclonal, endogenously expressed VASP-eYFP and IRSp53-tdTomato B16F1 cell line shows poor colocalization of the two proteins at VASP foci. Arrowheads: VASP-eYFP foci; yellow bar: filopodia shaft. (C) The time-averaged integrated intensities of VASP-eYFP and Lpd-tdTomato within leading edge foci are tightly correlated (black circles). A plot of average Lpd intensity versus VASP intensity fits a straight line (R2 = 0.79). In contrast, the integrated intensities of VASP-eYFP and IRSp53-tdTomato within leading edge foci are not correlated (red squares; R2 = 0.00014). (D) Zoomed plot of the VASP-eYFP and IRSp53-tdTomato dataset shows the lack of correlation in their intensities.

