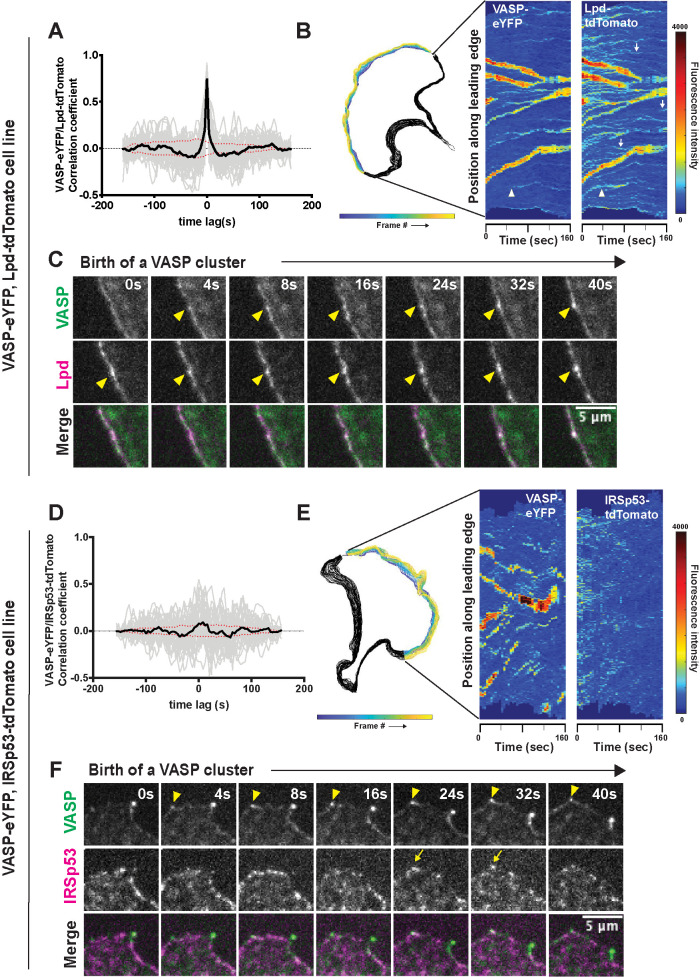
FIGURE 3:
Dynamics of VASP clustering with its leading-edge binding partners, Lpd and IRSp53. (A) Temporal cross-correlation analysis of fluctuations in VASP and Lpd intensity at leading edge foci. Gray lines are individual cross-correlation measurements and the solid black line, which is symmetrical about zero, is the average of individual traces from 58 different clusters from four experiments. Red dotted lines indicate an estimated 95% confidence interval of significance. Peak cross correlation occurs at time lag 0 s with a correlation coefficient of r = 0.75. (B) Cell outline of changing leading edge positions over 40 frames (Left). Adaptive kymograph map (Right) displaying VASP-eYFP and Lpd-tdTomato dynamics over time (40 frames; 160 s). (C) Frames from time-lapse microscopy of VASP clusters being born from small preexisting Lpd clusters (arrowheads) at the leading edge in double knock-in VASP-eYFP(green)/Lpd-tdTomato (magenta) B16F1 cells. (D) Temporal cross-correlation of VASP-eYFP and IRSp53-tdTomato fluorescence signal at leading edge foci. Gray lines are individual cross-correlation measurements and the solid black line (the average of 34 clusters from three experiments) shows a weak peak occurring at time lag 8 s with a correlation coefficient of 0.09. Red dotted lines indicate an estimated 95% confidence interval of significance. (E) Cell outline of changing leading edge positions over 40 frames (left). Adaptive kymograph map (right) displaying VASP-eYFP foci and IRSp53-tdTomato dynamics over time (40 frames; 160 s). Color map: blue (low fluorescence intensity) to red (high fluorescence intensity). (F) Frames from time-lapse microscopy of VASP clusters (arrowhead) forming with no detectable accumulation of IRSp53-tdTomato until after the VASP foci is formed (arrow).

