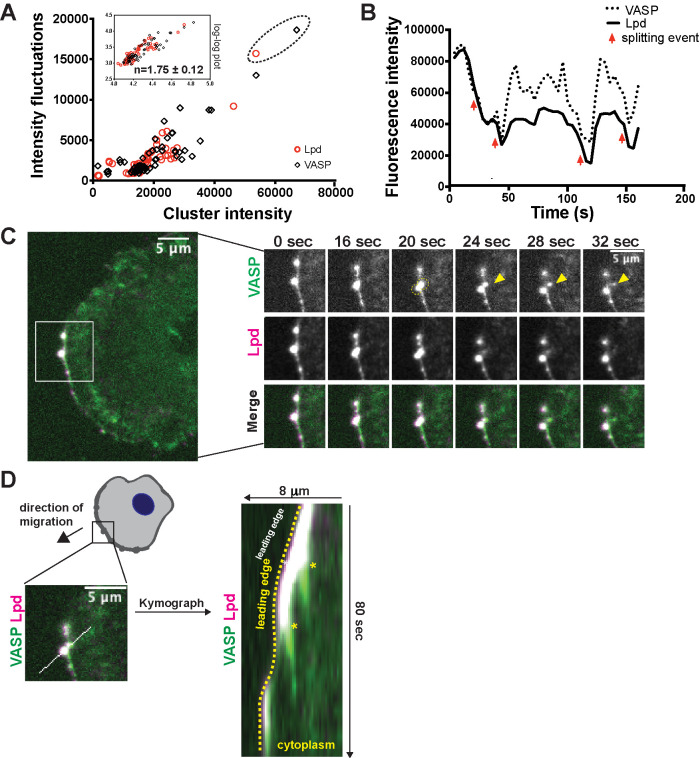
FIGURE 4:
VASP/Lpd clusters exhibit size-dependent splitting behavior. (A) Fluctuations in VASP and Lpd were quantified by plotting the SD of fluorescence intensity of VASP (black diamond) and Lpd (red circle) foci versus their time-averaged VASP (or Lpd) intensity. Inset: log plot of SD vs. time-averaged VASP/Lpd intensity fits a line with slope = 1.75 ± 0.12. (B) Intensity trace of the fluorescence intensity of a single VASP/Lpd focus from C. Red arrows indicate simultaneous drops in both VASP and Lpd fluorescence intensity, which correlate to splitting events. (C) Image (left panel) of double knock-in VASP-eYFP(green) Lpd-tdTomato(magenta) B16F1 cell with ROI indicating the VASP/Lpd cluster that undergoes a splitting event in which VASP material splits from the parental cluster (right panels, yellow arrow). (D) Kymograph of a ROI bisecting both the main VASP/Lpd cluster and secondary VASP clump that is shed indicates that the shed VASP does not move relative to the lab frame of view (asterisks). Dotted yellow line outlines the leading edge.

