Figure 7.

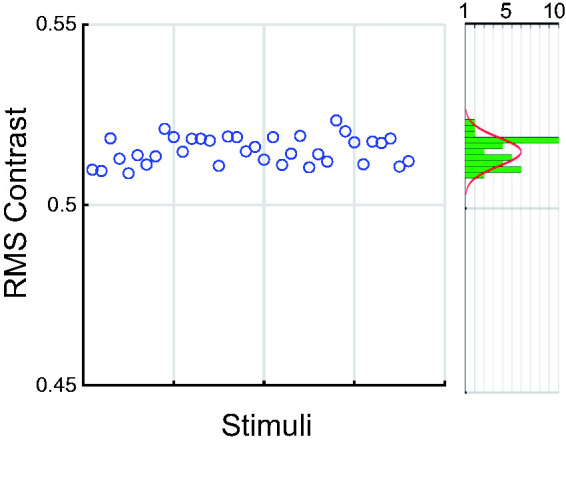
RMS Contrast for the 36 Stimuli. The marginal figure shows the histogram and a normal distribution fit to the RMS contrasts.

RMS Contrast for the 36 Stimuli. The marginal figure shows the histogram and a normal distribution fit to the RMS contrasts.