
Figure 5.
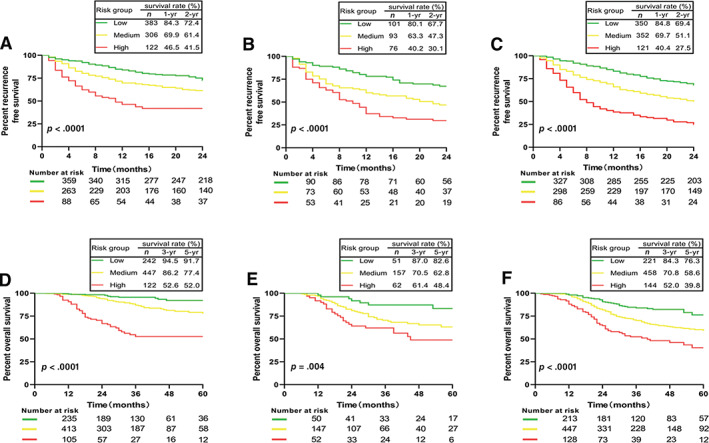
Survival curves for subgroup of patients with different risk of postsurgical recurrence or mortality stratified by nomogram score. (A): Recurrence‐free survival (RFS) curves in derivation cohort. (B): RFS curves in the internal validation cohort. (C): RFS curves in the external validation cohort. (D): Overall survival (OS) curves in the derivation cohort. (E): OS curves in the internal validation cohort. (F): OS curves in the external validation cohort.