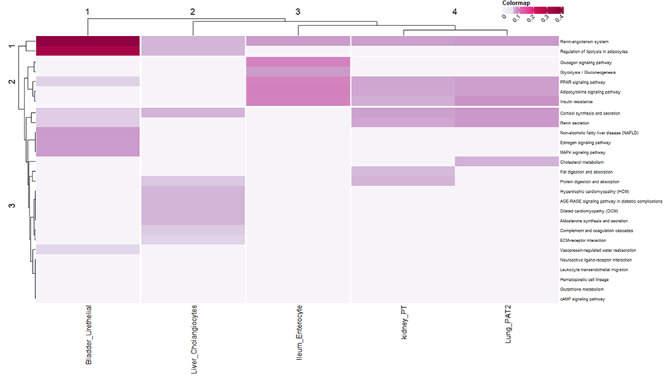
Figure 10.

The heatmap is performed depending on the PageRank algorithm scores of each pathway. According to the overall ranking and scoring, the pathways are well segregated in the heatmap. The organ-specific cell types that possess high expression level of ACE2 are considered here. The pathways having AGT and PPAR family are ranked high in ileum, whereas insulin resistance is missing. Also, PPAR signaling pathway is absent in liver cell types. Whereas, cortisol synthesis and secretion is also found as a key player in some of the cell types.
