
Figure 11.
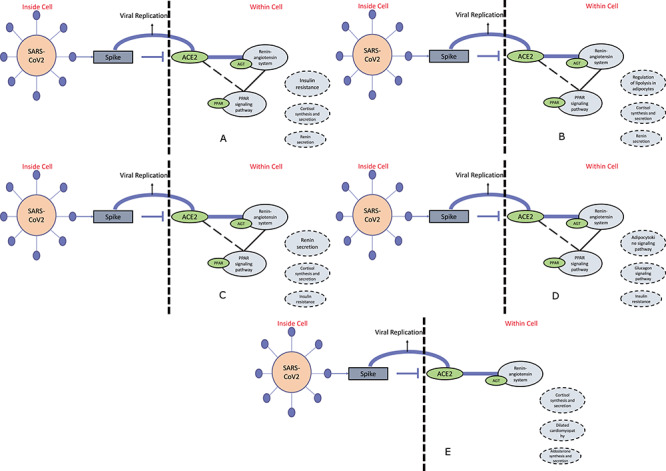
To map the results from pathway semantic and PageRank algorithm within the cell environment, in (A) for PAT2 cell type of lung the top three ranked pathways excluding RAS and PPAR signaling pathway are shown, whereas the flowchart in (B) urothelial cells and (C) proximal tubule cells of organ bladder and kidney, respectively, show three ranked pathways including RAS and PPAR signaling pathway. For ileum (D) rnterocyte progenitor cells and (E) cholangiocytes of liver, three pathways excluding RAS and PPAR signaling pathway are reported. As these two pathways are missing in cholangiocytes cell type. These flowcharts of organ-specific cell types help to reveal the information regarding activating other pathways at the time of this epidemic disease.