
Figure 7.
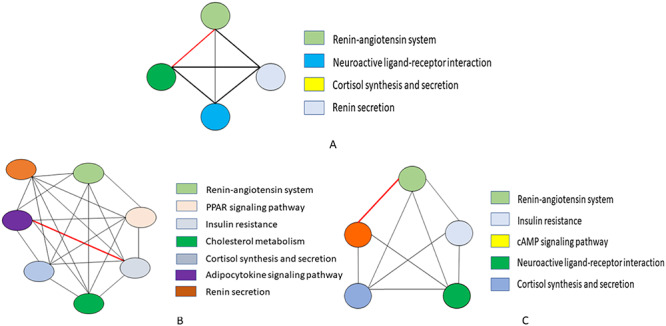
A cell-type-specific pathway semantic similarity graph: (A) mast cell type, (B) PAT2 and (C) plasma cell of lung are established by considering the biological process associated with each pathway. Here, the nodes represent a particular pathway and their connecting edges define the weight between two pathways in order to apprehend the highest sharing biological process. The red marked bold edge in the graphs indicate the higher association score of between those pathways.