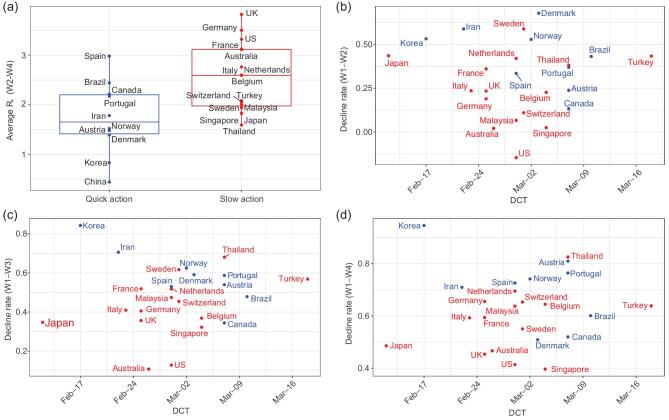
Figure 1.
(a) Box plots for the average estimated reproduction numbers Rt in Weeks 2–4 since the DCT between the 10 quick action countries and the 15 slow action countries. Scatter plots of weekly decline rates in the average effective reproduction number Rt (China excluded) from Week 1 to those of Week 2 (b), Week 3 (c) and Week 4 (d), respectively, versus the lead times (from the DCT of non-Hubei China to the DCT of another country). The header to panel (a) reports the one-sided two-sample t-statistic (P-values), and those to panels (b)–(d) report the correlation coefficients (P-values for testing zero correlation) between the declined rates and the lead times among the 24 countries without China. The quick (slow) action countries are marked in blue (red).

