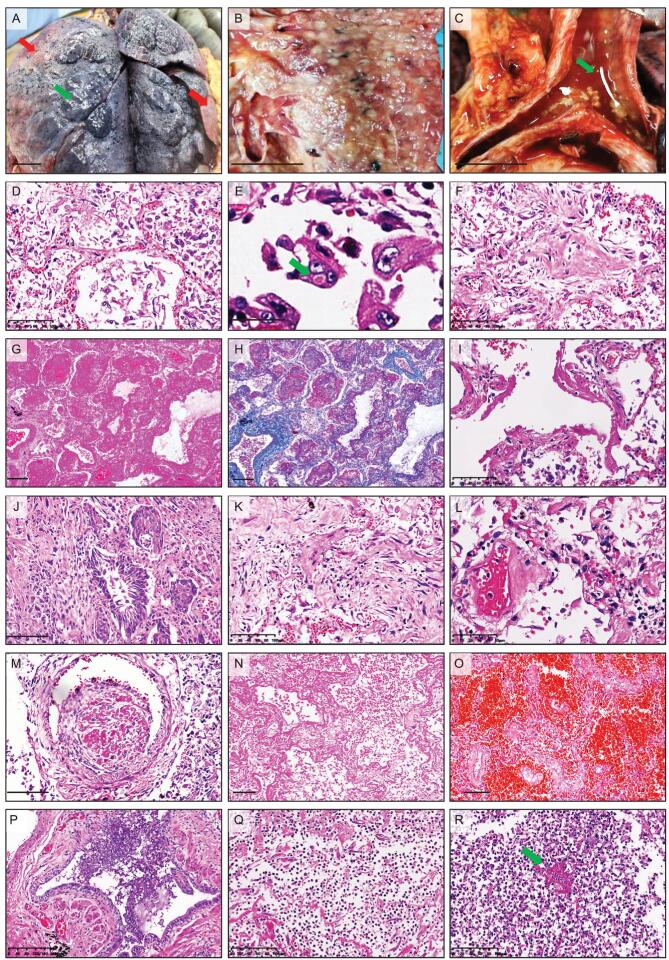
Figure 1.
Pulmonary changes in COVID-19 autopsy cases. (A–B) Gross images of the postmortem lungs (Case 10 in A and Case 5 in B) showing the bilateral consolidation (red arrows) and peripheral pulmonary bullae formation (green arrows). (C) Gross images (Case 5) showing the exudate or secretion (green arrows) in the tracheal lumen. (D–E) H&E staining showing the extensive pneumocyte exfoliation and type II pneumocyte hyperplasia (D, Case 4) and the virus inclusion body (green arrows) in the exfoliated type II pneumocytes (E, Case 1). (F–I) H&E staining (F, G, I) and Masson staining (H) showing protein-enriched exudation (F, Case 4), fibric organization (G-H, Case 12) and hyaline membranes (I, Case 5) in alveolar space. (J) H&E staining showing the squamous metaplasia in the bronchioles (Case 7). (K) H&E staining showing the interstitial fibrosis and inflammatory cell infiltration (Case 7). (L) H&E staining showing vasculitis (Case 1). (M) H&E staining showing thrombi in small vessels (Case 9). (N–O) H&E staining showing the coagulation necrosis (N, Case 1) and pulmonary hemorrhage (O, Case 10). (P) H&E staining showing mucous exudate in the bronchioles (Case 3). (Q–R) H&E staining showing the marked inflammatory cell infiltration in the alveoli of COVID-19 patients with secondary bacterial infection (Case 2) or fungal infection (Case 5, fungi are indicated by the green arrow). Scale bar = 2 cm (A–C), 100 μm (D, F, I, J, K, M–O, Q, R), 20 μm (E), 200 μm (G–H, P) or 50 μm (L).

