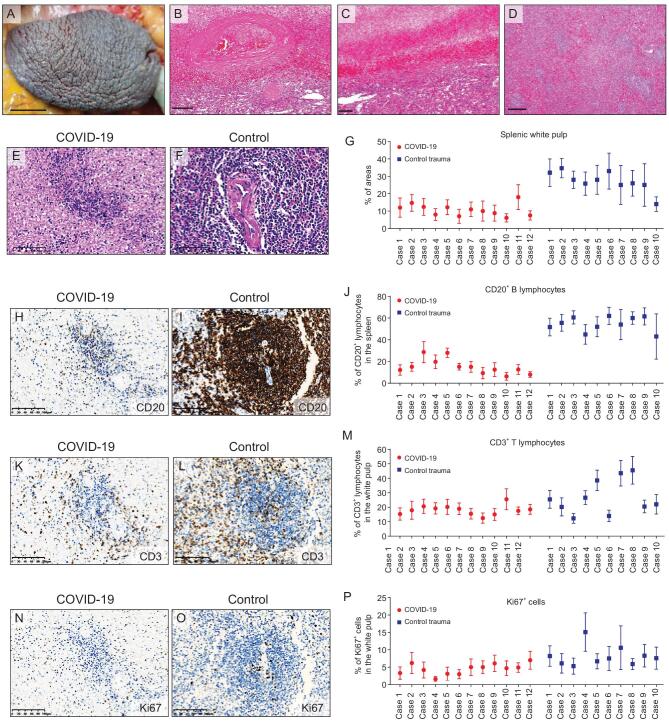
Figure 3.
Changes in the spleens of COVID-19 autopsy patients. (A) Gross image showing the contracted spleen with shrinking capsule (Case 6). (B and C) H&E staining showing the mixed thrombi (B) and anemic infarction (C) in the COVID-19 spleens. (D) H&E staining showing the white pulp and red pulp in a COVID-19 spleen (Case 1). (E–G) H&E staining (E and F) and the quantification (G) of the proportion of white pulp areas in the spleens from COVID-19 autopsy cases and control spleens derived from trauma-associated splenectomy. (H–J) IHC staining of CD20 (H and I) and proportion of CD20-positive cells (J) in the spleens from COVID-19 cases and the control trauma spleens. Proportion of CD20-positive cells was calculated as the positive cells versus total cells in at least 10 randomly selected spleen areas under ×200 magnification of microscopic fields. (K–M) IHC staining of CD3 (K and L) and proportion of CD3-positive lymphocytes (L) in the spleens from COVID-19 cases and the control trauma spleens. (N–P) IHC staining of Ki67 (N and O) and proportion of Ki67-positive cells (P) in the spleens from COVID-19 cases and the control trauma spleens. Proportion of CD3- or Ki67-positive cells was calculated as the positive cells versus total cells in at least 10 randomly selected white pulp areas under ×200 magnification of microscopic fields. Data are presented as mean ± SD (G, J, M and P). Scale bar = 1.5 cm (A), 200 μm (B–D) or 100 μm (E, F, H, I, K, L, N and O).

