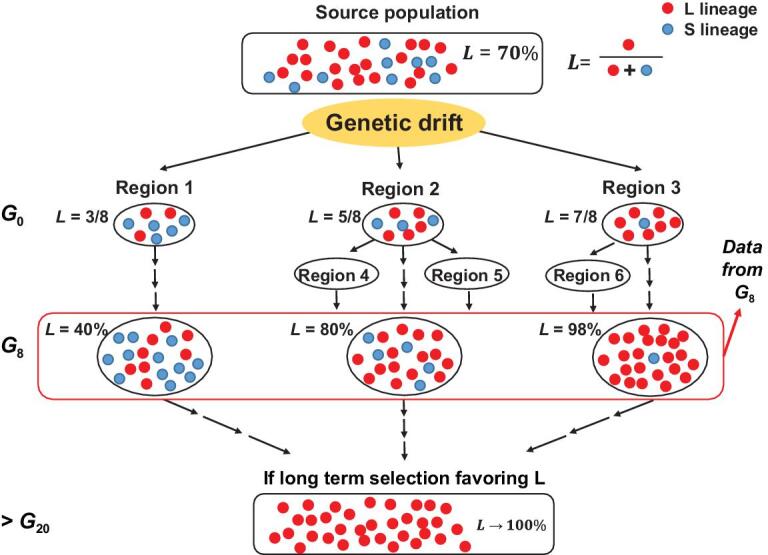
Figure 1.

Schematic diagram of viral population divergence among regions. In G0 (generation 0), I0 = 8 and infected individuals arrive in regions 1–3 with 3, 5 and 7 of them, respectively, carrying the L-type virus. In the beginning, genetic drift is particularly strong and the frequency of L fluctuates as modeled by the Branching Process. G8 is about 5 weeks after the first arrival when the data are collected. After G8, the fluctuation is greatly dampened due to the large population size. In the later stage (after G20), even weak selection could drive gene frequency toward the fixation of the more contagious genotype. Regions 4–6 are not independent samples and are not included in the analysis (see Data of the main text).
