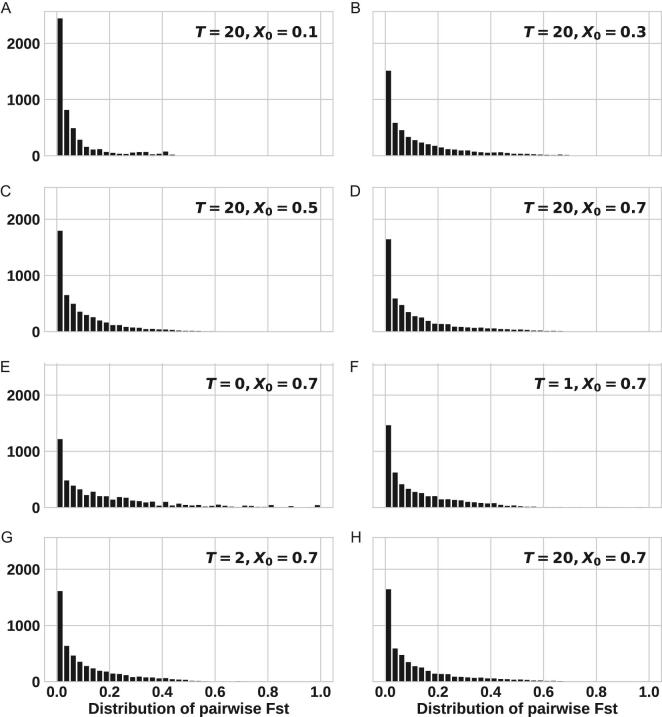
Figure 3.
The Fst distribution at G20. For each parameter set of (I0, T, X0, s), we repeat the simulations 100 times. For all panels, I0 = 10, s = 0. Panel A–D, T = 20 and X0 ranges from 0.1 to 0.7. Panel E–H, X0 = 0.7, T ranges from 0 to 20. These eight panels show that neither X0 nor T would impact the Fst distribution much.

