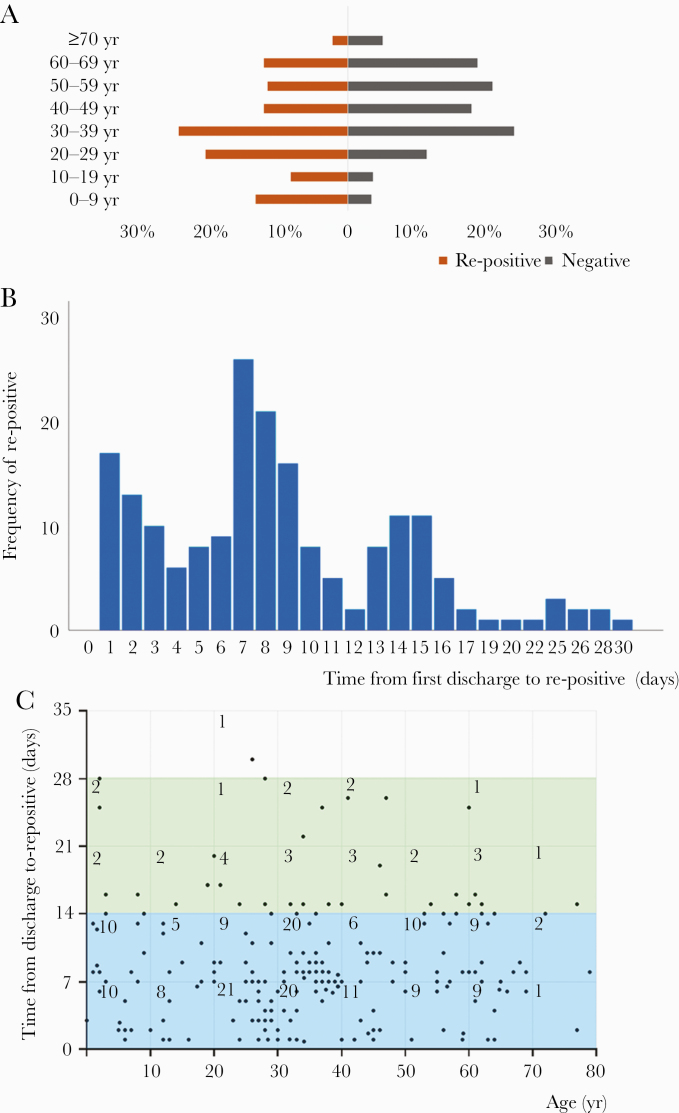
Figure 2.
Age distributions and the features of re-positive ribonucleic acid (RNA) in re-positive patients. As shown in A, age pyramid count graph, patients in the re-positive group account for 12.70% in patients aged 0–9 years, 7.94% in patients aged 10–19 years, 19.58% in patients aged 20–29 years, 23.28% in patients aged 30–39 years, 11.64% in patients aged 40–49 years, 11.11% in patients aged 50–59 years, 11.64% in patients aged 60–69 years, and 2.12% in patients aged ≥70 years, whereas patients in the negative group account for 3.20% in patients aged 0–9 years, 3.39% in patients aged 10–19 years, 10.89% in patients aged 20–29 years, 22.87% in patients aged 30–39 years, 17.02% in patients aged 40–49 years, 19.85% in patients aged 50–59 years, 17.93% in patients aged 60–69 years, and 4.85% in patients aged ≥70 years. As shown in B, bars represent frequency of patients tested re-positive from first discharge to re-positive at different re-positive time. Taller bars illustrate 1–15 days, presented with 3 peaks at the 1st, 7th, and 14th day. Eighteen cases (9.5%) exceeded 15 days for severe acute respiratory syndrome coronavirus 2 RNA re-positive. As shown in C, time from first discharge to re-positive was divided by per 7 days and matched with age group divided by per 10 years. The figures in the boxes represent the number of cases. The area of 0–21 days in the y axis, especially of 0–14 days, contains the largest number of dots, which represent patients. The number of patient days from first discharge to re-positive are as follows: 89 patients, ≤7 days; <71 patients, 7 days; <20 patients, 14 days, ≤14 days; <8 patients, 21 days; <1 patient, ≤28 days, 28 days . In addition, in the x-axis, the density of dots in the area of 20–40 years is the highest; 81 dots are located in this area.

