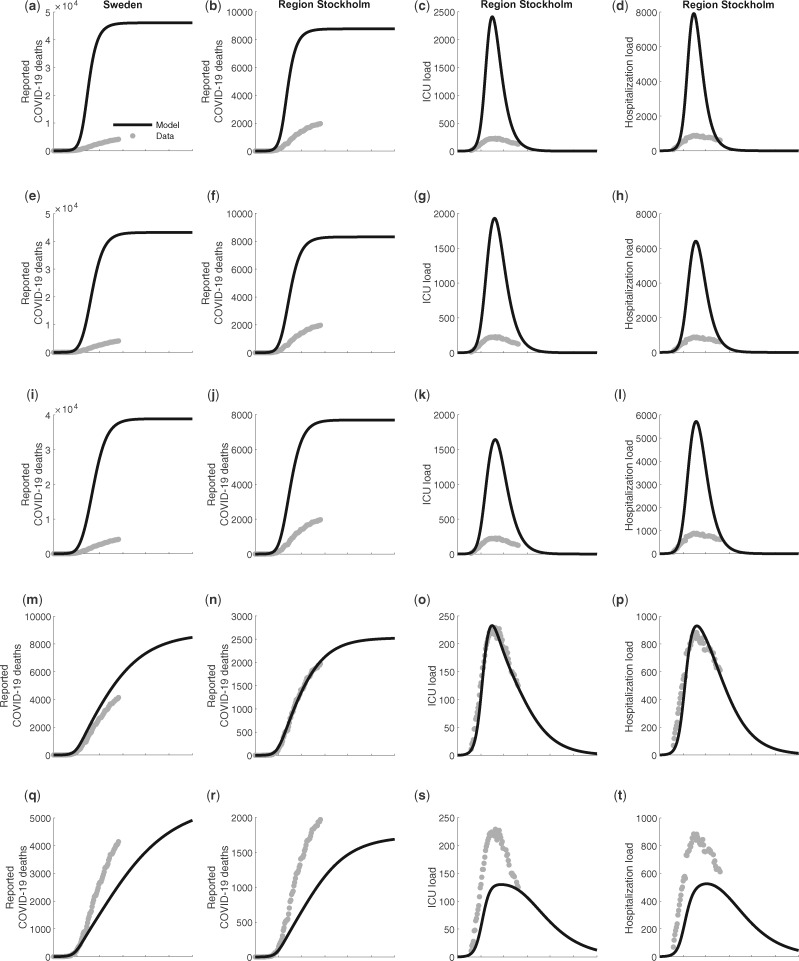
Figure 1.
Predicted number of total deaths from COVID-19 in the whole population in Sweden (first column), and for Stockholm region (second column); predicted demand of ICU beds in Stockholm (third column), and; inpatient care beds in Stockholm (fourth column). Actual observations in the early phase of the outbreak are illustrated as circles (O). The scenarios are organized in rows with panel (a) no public health interventions (counterfactual scenario); (b) modest physical distancing in ages 0–59 years, moderate in ages 60+ years; (c) modest physical distancing in ages 0–59 years, moderately strong in ages 60+ years; (d) moderate physical distancing in ages 0–59 years, very strong in ages 60–79 years, strong in ages 80+ years, and with an increased degree of isolation of infectious individuals; (e) moderate physical distancing in ages 0–59 years, strong in ages 60+ years, and further improved isolation of infectious individuals. Mitigation giving rise to these predicted values had onset the 20th of March.

