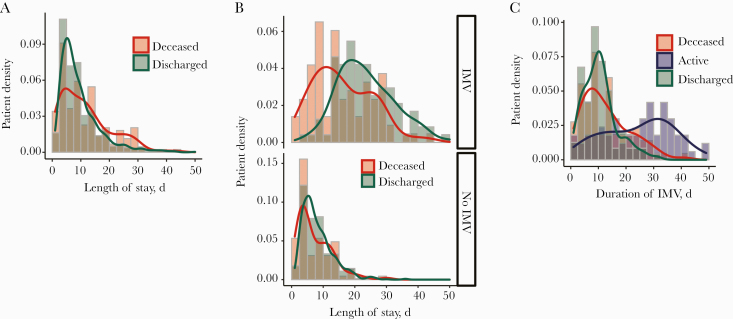
Figure 3.
Hospital length of stay in study patients. A, Histogram shows the patient density with respect to hospital length of stay (days) in the patients with a disposition (median [IQR] length of stay for deceased, 10 [4–16] days) and discharged alive (median [IQR] length of stay, 8 [5–12] days; P = .003, Welch 2-sample t test). B, Histogram shows the patient density (IQR) with respect to hospital length of stay (days) in the patients with a disposition (deceased and discharged alive) on invasive mechanical ventilation (IMV; top panel); IMV: deceased (15 [10–23.75] days), discharged alive (22 [16.5–29.5] days; P = 3.8e-07, Welch 2-sample t test), and no IMV (bottom panel); no IMV: deceased (5 [3–11] days), discharged alive (7 [5–10.25] days; P = .216, Welch 2-sample t test). C, Histogram shows the patient density (IQR) with respect to total days on IMV (days) in the deceased, discharged alive, and active patients without a disposition. Deceased (10 [6.5–17.5] days), active (26 [14–34] days), discharged alive (10 [6–13] days; P = .04, Welch 2-sample t test between deceased and discharged alive).

