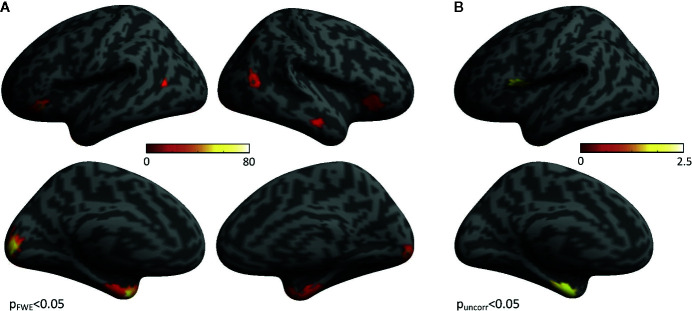
Figure 2.
Regions Activated During the Task. (A) Group-level statistical activation maps of stimulus-induced gamma-band activity from Suicide Implicit Association Task (S-IAT) administration. (B) Group-level statistical activation maps of stimulus-induced gamma-band activity from the contrast between self-death and self-life trials as part of S-IAT administration.

