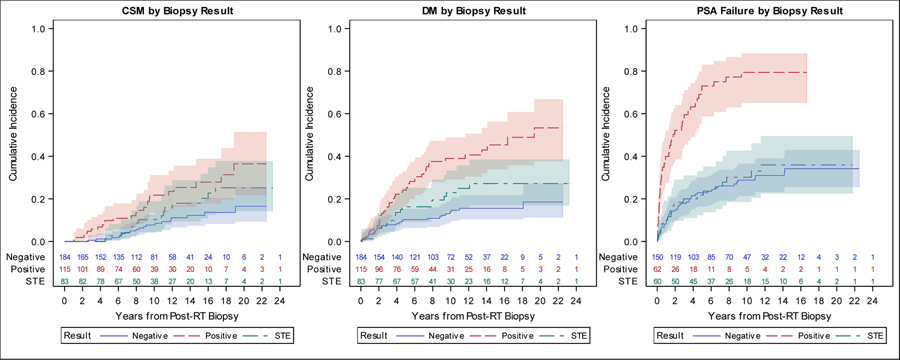
Figure 1.
CSM, DM and PSA Failure Cumulative Incidence Plots by Biopsy Result (Positive, Negative, and STE)
Legend: This plot displays the cumulative incidence of (a) cause specific mortality, (b) distant metastases, (c) PSA failure after biopsy stratified by biopsy findings. In this figure, STE and negative are represented by separate curves. These figures illustrate that patients with STE have similar incidence of outcomes compared to patients with negative biopsy.

