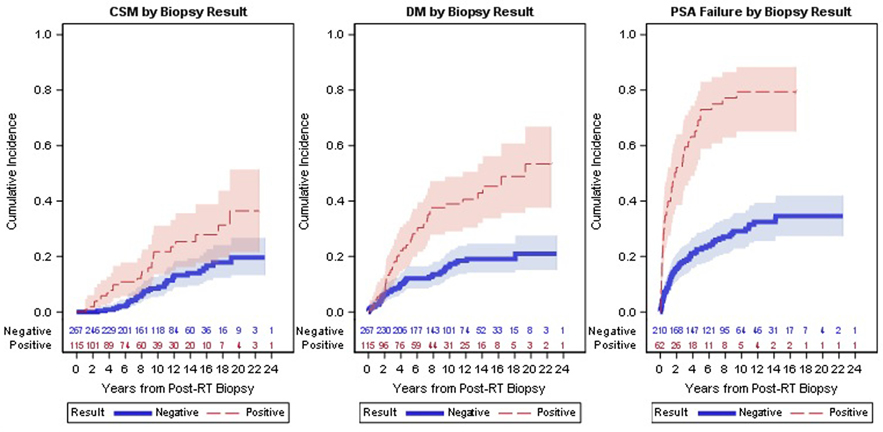
Figure 2.
CSM, DM and PSA Failure Cumulative Incidence Plots by Biopsy Result (Positive and Negative)
Legend: Figure displays the cumulative incidence for the three primary outcomes: (a) cause specific mortality, (b) distant metastases, and (c) PSA failure after biopsy result. Negative biopsies include those with severe treatment effects.

