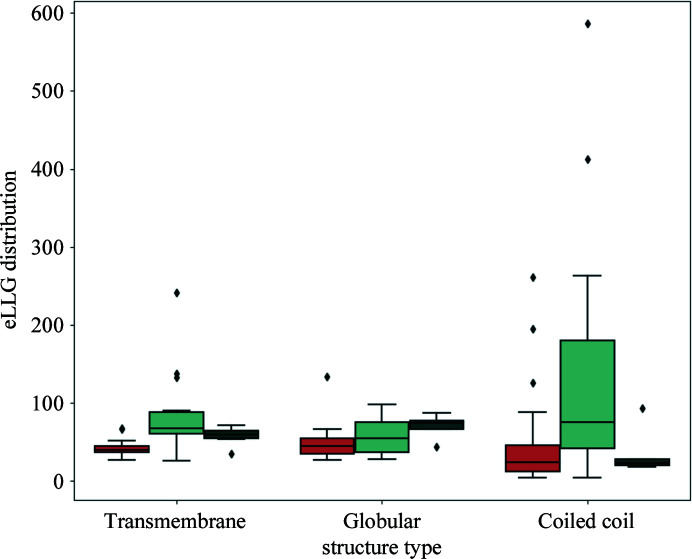
Figure 4.
A box plot of the range of eLLGs for structures that could not be solved using either single model ideal helices or ensembles (orange), those that were solved using both single model ideal helices and ensembles (light turquoise), and those that could only be solved by AMPLE when using members of the new ensemble library as search models (dark turquoise). Box limits indicate upper and higher quartiles, whiskers indicate upper and lower bounds and the horizontal line in the middle of the box plot represents the median. Outliers are depicted as rhombi.

