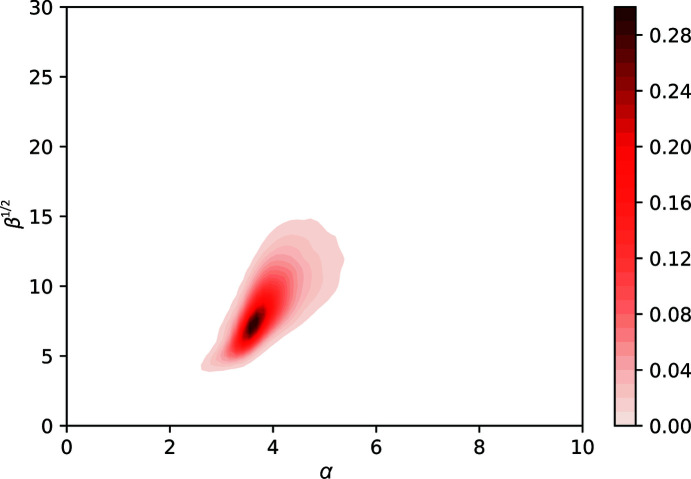
Figure 1.
Smoothened α versus β1/2 plot for unimodal ADP distributions. Parameters are estimated using around 90 000 PDB entries after ten cycles of refinement. This plot was first presented by Masmaliyeva & Murshudov (2019 ▸) using around 45 000 PDB entries. The overall features of the plot are the same as those presented previously. This plot is used in ToBvalid for the validation of SIGD parameters.

