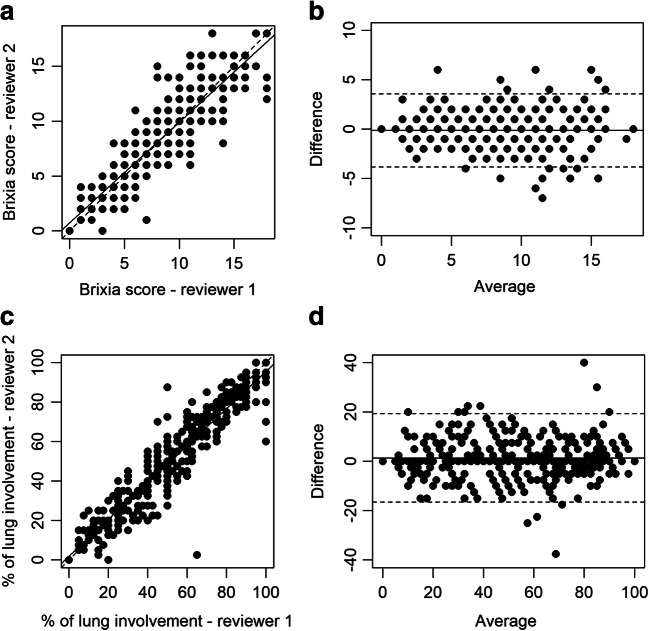
Fig. 1.
Correlation and agreement between chest X-ray findings obtained by two independent reviewers in 340 patients with confirmed COVID-19. Correlation and Bland-Altman plots show the agreement in Brixia score (a, b) and percentage of lung involvement (c, d) between the reference reviewer (reviewer 1, a thoracic radiologist with 5 years of experience) and reviewer 2 (a fourth-year radiology resident). In correlation plots, the dashed line denotes the line of perfect concordance, while the solid line denotes the reduced major axis. In Bland-Altman plots, the solid line denotes mean difference, while dashed lines denote mean difference ± 2 standard deviations

