
Figure 5.
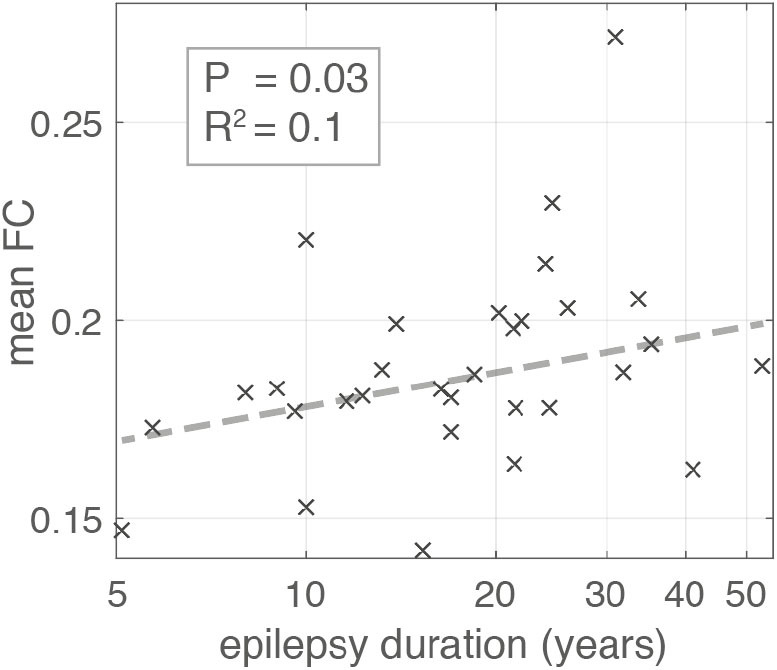
Scatter plot illustrating the relationship between Epilepsy duration in years and mean global functional connectivity. Each “x” marker represents an individual patient. Dashed line represents the line of best fit using bisquare linear regression robust to outliers. The association is significant with p-value = 0.03 (likelihood ratio test) and adjusted R2 = 0.1.