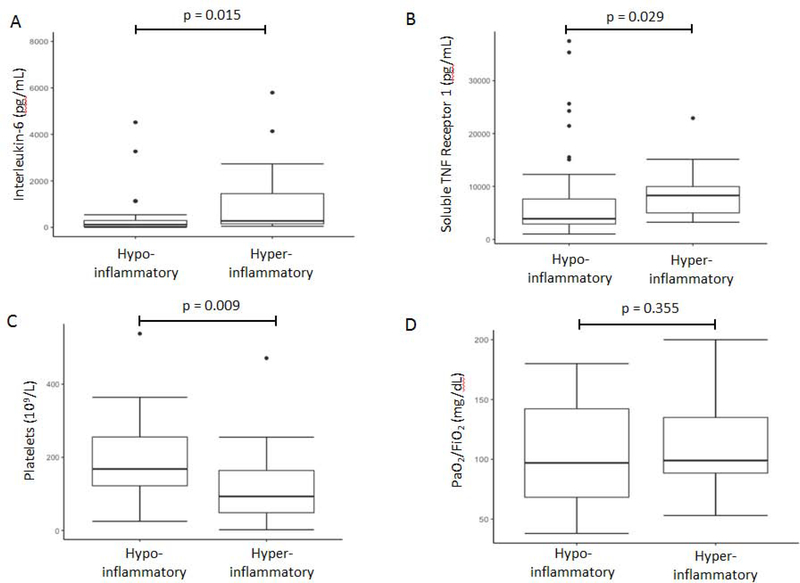
Figure 4. Box-Whisker plot depicting difference in key variables between the hyperinflammatory and hypo-inflammatory phenotypes in START using the 3-variable model (Interleukin-8, bicarbonate, and protein C) with a probability cut-off of ≥ 0·5 to assign phenotype.
A. Interleukin-6 (one value not shown in hypo-inflammatory class due to y-axis censoring for visual interpretation) B. Soluble tumour necrosis factor receptor-1 C. Platelet count D. PaO2/FiO2 (P-values are representative of Man-Whitney-U test).

