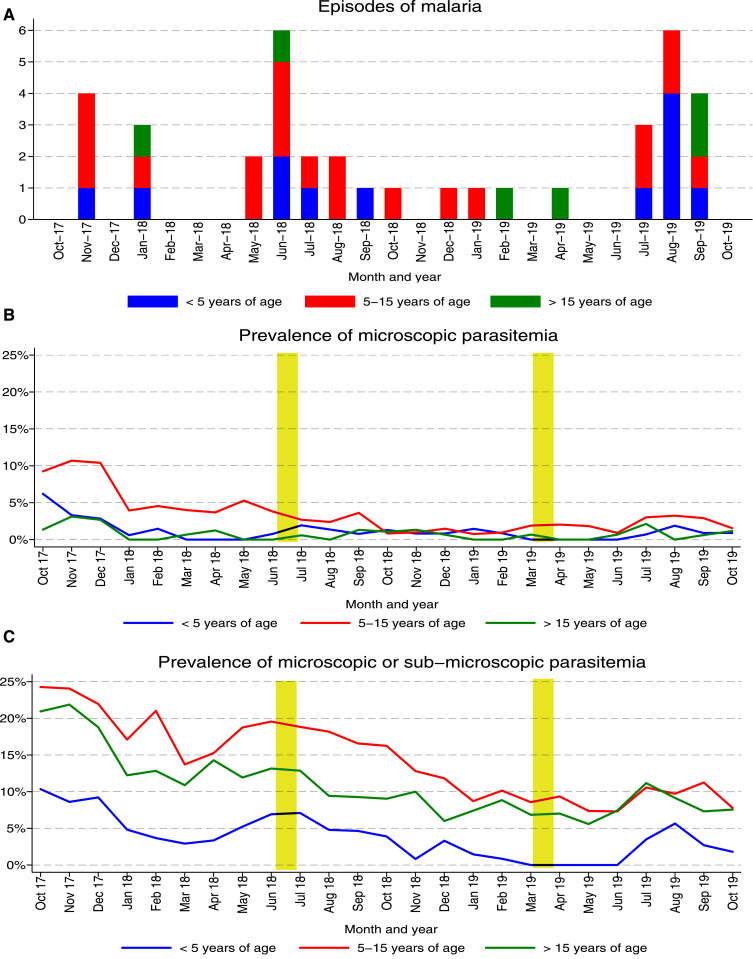
Figure 4.
Temporal changes in the incidence of malaria and prevalence of parasitemia from the current cohort study (October 2017–October 2019). (A) Monthly episodes of symptomatic malaria stratified by age-group. (B) Monthly trends of microscopic parasitemia stratified by age-group. An interactive plot is available at https://clinepidb.org/ce/app/workspace/strategies/import/7eeab4ea9951b3cd. (C) Monthly trends of microscopic or submicroscopic parasitemia stratified by age-group. (Yellow bars signify rounds of indoor residual spraying with pirimiphos-methyl.) This figure appears in color at www.ajtmh.org.

