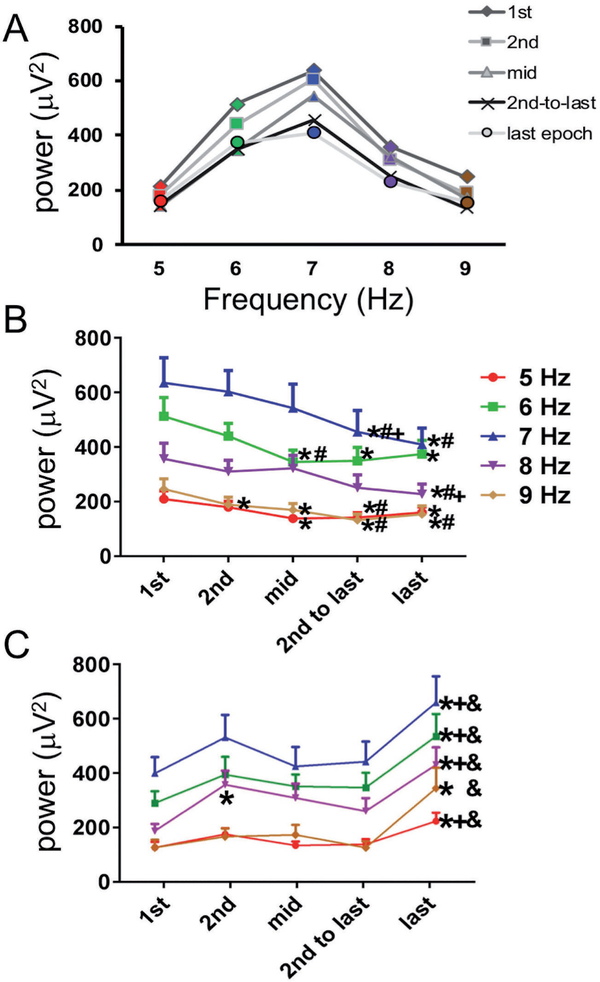
Fig. 4. –
The individual bands that comprise the theta band (5, 6, 7, 8, and 9 Hz) show a similar pattern of decreasing power from the initial epochs of the REM sleep bout compared the later epochs of same REM sleep bout. Panels A and B are calculated from the 73.4% of REM sleep bouts with decreasing power. The 23.6% of REM sleep bouts that showed increasing power increased from the initial or 2nd to last epoch to the last epoch of the REM sleep bout (C). Symbols next to data points mean the time point is significantly different from: * 1st epoch, # 2nd epoch, + middle epoch, & 2nd-to-last epoch.

