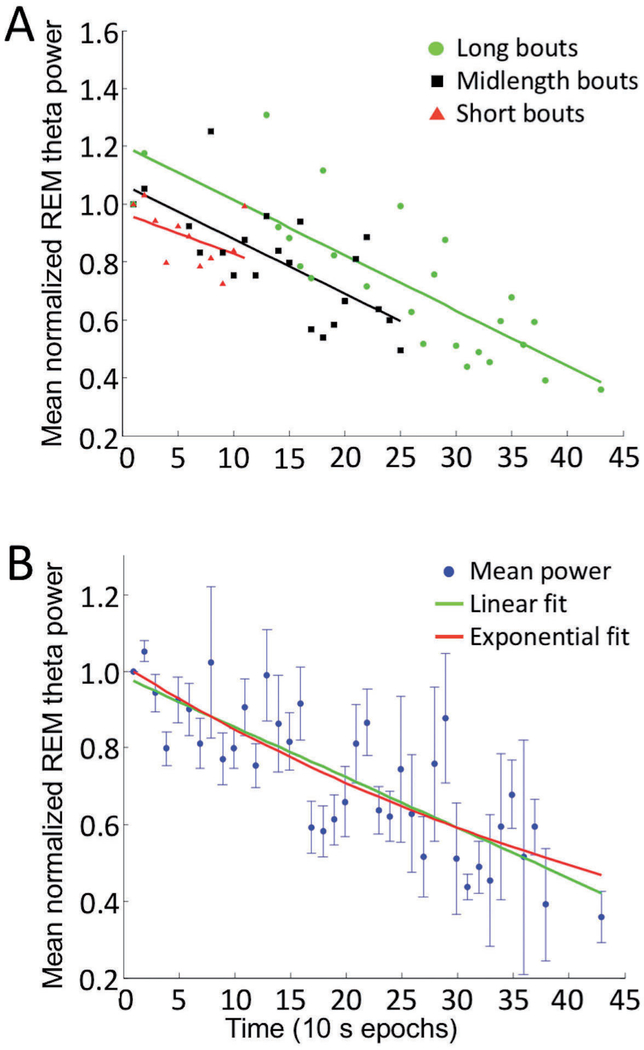
Fig. 5. –
Fit of theta power (normalized to the initial epoch) over time in all REM sleep bouts (A) parsed by length into short, midlength, or long bouts. Linear fit lines corresponding to each bout length are shown in the same color as the group. (B) Theta power normalized to the first epoch and averaged from all REM sleep bouts at each time point was fit by linear (green) and exponential (red) curves. Overall, theta power decreases across the bout can be fit equally well by linear and exponential curves.

