
Fig. 6.
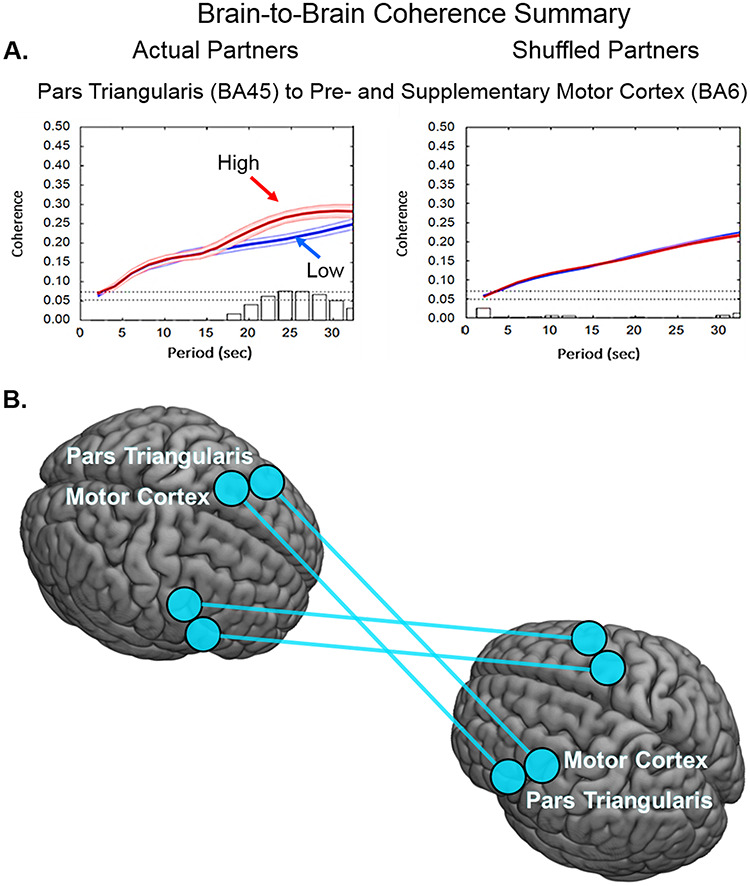
(A) Coherence of brain-to-brain signals for high-disparity dyads. (A) Signal coherence between dyads (y-axis) is plotted against the period (x-axis) for the high-disparity (red) and the low-disparity (blue) conditions (shaded areas: ± 1 SEM). Bar graphs indicate significance levels for the separations between the two conditions for each of the period values on the x-axis. The upper horizontal dashed line indicates (P ≤ 0.01) and the lower line indicates (P ≤ 0.05). Left panel shows coherence between actual partners, and right panel shows coherence between shuffled partners. Cross-brain coherence is greatest in the high-disparity group between pars triangularis (BA45) and pre- and supplementary motor cortex (BA6) (partners: P = 0.006, t = 2.87; shuffled: no significant effect). (B) Anatomical illustration of the regional pairs with increased synchrony for high-disparity dyads.