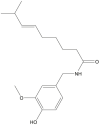
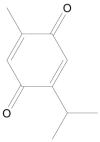
Table 1.
Chemical structures, plant sources, docking scores, and binding features for 32 natural spices against SARS-CoV-2 main protease (Mpro).
| Compound Name |
Chemical Structure | Plant Source |
Docking Score (kcal/mol) | Binding Featuresa |
|---|---|---|---|---|
| Salvianolic acid A |  |
Salvia officinalis (Sage) | −9.7 | GLU166 (2.24, 2.15 Å), PHE140 (2.09, 2.21 Å), GLN189 (2.74, 2.06 Å), TYR54 (3.01 Å), THR190 (1.87, 1.86 Å) |
| Curcumin |  |
Curcuma longa (Turmeric) | −9.2 | HIS163 (1.90 Å), CYS145 (2.72 Å), GLY143 (2.85 Å), SER144 (1.97, 2.01 Å), LEU141 (1.94 Å) |
| Crocetin | Crocus sativus (Saffron) | −8.9 | ASP189 (1.84 Å), TYR54 (2.10 Å), CYS44 (1.79 Å), GLU166 (1.73 Å) | |
| Salvianolic acid B |  |
Salvia officinalis (Sage) | −8.5 | GLU166 (2.87, 2.33 Å), THR190 (2.27, 1.93, 1.81 Å), MET49 (2.38 Å), HIS41 (2.05 Å), GLY143 (2.67 Å) |
| Quercetin |  |
Crocus sativus (Saffron) | −8.3 | THR190 (1.82 Å), GLU166 (2.07, 2.18 Å), ASP187 (2.05 Å) |
| Piperine |  |
Piper nigrum(Black pepper) | −8.2 | GLN189 (3.07 Å), GLY143 (2.15 Å) |
| Picrocrocin |  |
Crocus sativus (Saffron) | −8.2 | CYS145 (2.48 Å), GLU166 (2.56 Å), SER144 (3.09 Å), LEU141 (2.78, 2.17 Å), SER144 (2.19 Å) |
| Mahanine |  |
Murraya koenigii(Curry leaf) | −8.0 | MET165 (2.51 Å), THR190 (1,83 Å) |
| Capsanthin |  |
Capsicum annum (Sweet pepper) | −8.0 | TYR26 (2.60 Å), SER144 (2.79 Å), CYS145 (1.88 Å) |
| Capsaicin |  |
Capsicum annuum (Chili pepper) | −8.0 | THR190 (2.25 Å), GLU166 (2.10, 2.10 Å) |
| Carnosol |  |
Rosmarinus officinalis (Rosemary) | −7.9 | GLU166 (2.21 Å) |
| Tanshinone I |  |
Salvia officinalis (Sage) | −7.8 | GLU166 (1.95 Å) |
| Kaempferol |  |
Crocus sativus (Saffron) | −7.8 | THR190 (1.96 Å), ASP187 (1.95 Å), HIS164 (2.22 Å) |
| Baicalin |  |
Rosmarinus officinalis (Rosemary) | −7.6 | ASN142 (2.54 Å), GLY143 (2.14 Å), HIS163 (2.10 Å) |
| Cryptotanshinone |  |
Salvia officinalis (Sage) | −7.6 | GLU166 (1.92 Å) |
| Girinimbine |  |
Murraya koenigii(Curry leaf) | −7.5 | MET165 (2.80 Å), ARG188 (2.10 Å) |
| Shogaols |  |
Zingiber officinale (Ginger) | −7.4 | THR190 (2.27 Å), GLU166 (2.01 Å) |
| Carnosic acid |  |
Rosmarinus officinalis (Rosemary) | −7.3 | GLN189 (2.18 Å) |
| Gingerols |  |
Zingiber officinale (Ginger) | −7.1 | THR190 (2.21 Å), GLU166 (2.01 Å), HIS164 (1.80 Å) |
| Tanshinone IIA |  |
Salvia officinalis (Sage) | −6.7 | ---b |
| Marliolide |  |
Cinnamomum verum (Cinnamon) | −6.2 | THR190 (2.03 Å) |
| Zingerone |  |
Zingiber officinale (Ginger) | −5.7 | CYS44 (2.74 Å), GLU166 (2.18 Å) |
| Acetyleugenol |  |
Zingiber officinale (Ginger) | −5.3 | CYS145 (1.95 Å) |
| Thymoquinone |  |
Nigella sativa (Black seeds) | −5.2 | ---b |
| Safranal |  |
Crocus sativus (Saffron) | −5.2 | ---b |
| Eugenol |  |
Syzygium aromaticum (Cloves) | −5.1 | GLU166 (1.99 Å) |
| S-Allyl cysteine |  |
Allium sativum (Garlic) and/or Allium cepa (Onion) | −4.4 | ARG188 (2.14 Å), THR190 (1.92 Å), GLN192 (2.34 Å), GLU166 (1.85) |
| Di-allyl trisulfide |  |
Allium sativum (Garlic) and/or Allium cepa (Onion) | −4.1 | ---b |
| Dipropyl disulfide | Allium sativum (Garlic) and/or Allium cepa (Onion) | −3.7 | ---b | |
| Di-allyl disulfide | Allium sativum (Garlic) and/or Allium cepa (Onion) | −3.7 | ---b | |
| Dipropyl sulfide | Allium sativum (Garlic) and/or Allium cepa (Onion) | −3.6 | ---b | |
| Di-allyl sulfide | Allium sativum (Garlic) and/or Allium cepa (Onion) | −3.5 | ---b |
Conventional hydrogen bond only is listed. For the other interactions, see Fig. S1.
No hydrogen bond was observed.
