
Figure 1.
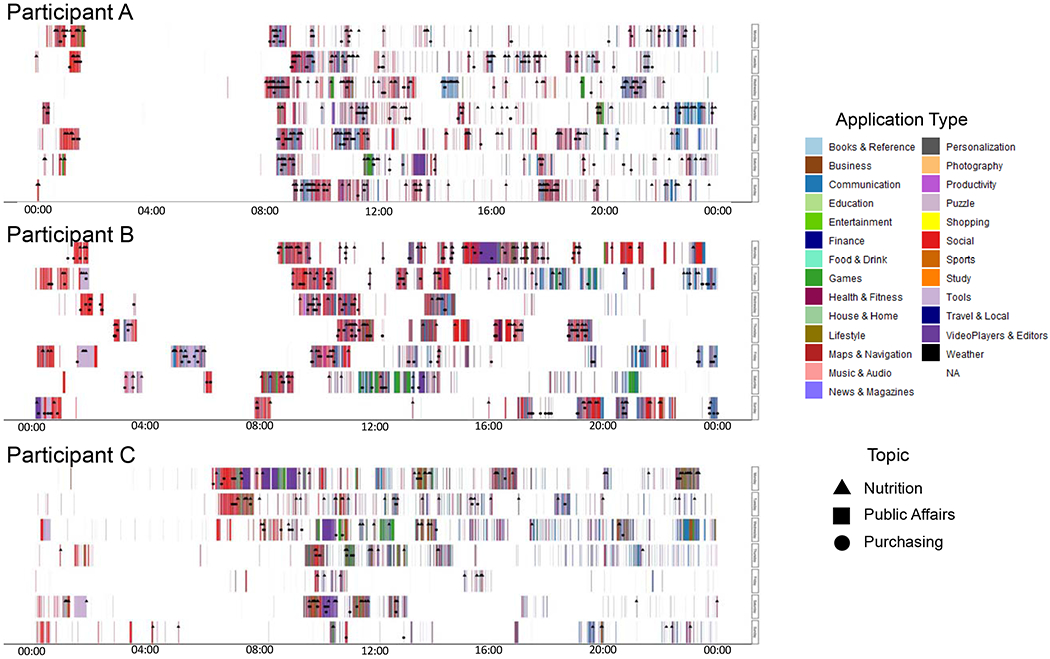
Three participants’ screenomes – where the rows indicate smartphone use during each of 7 consecutive days, from Midnight (left) to 23:59 PM (right) on Monday (top) to Sunday (bottom). Colored vertical bars indicate when the smartphone was in use and which application category was on the screen. Shapes and the locations of the shapes on the colored vertical bars indicate when words from the nutrition, public affairs, and/or purchasing dictionaries were present on the screen.