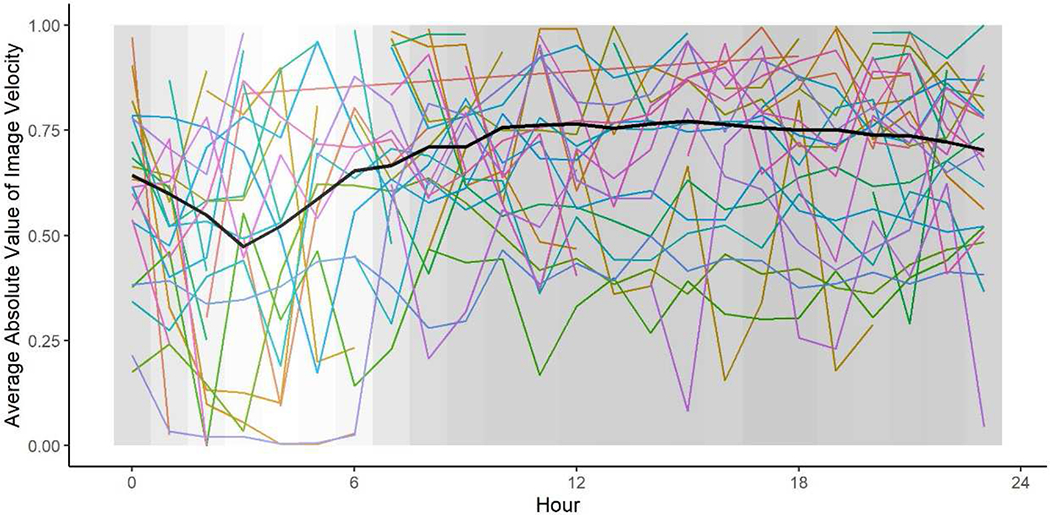
Figure 4.

Average absolute value of image velocity (in log seconds) hour-by-hour, from Midnight (left) to 23:59 PM (right). The black line represents the sample level average for those with phone use during those hours, and each colored line represents a participant’s average (subset of n = 30 participants to facilitate viewing of individuals’ trajectories). The background shading displays how many screenshots occurred during each hour across all participants, with the lightest color indicating the minimum number of screenshots (n = 74,297) and the darkest color indicating the maximum number of screenshots (n = 333,703).
