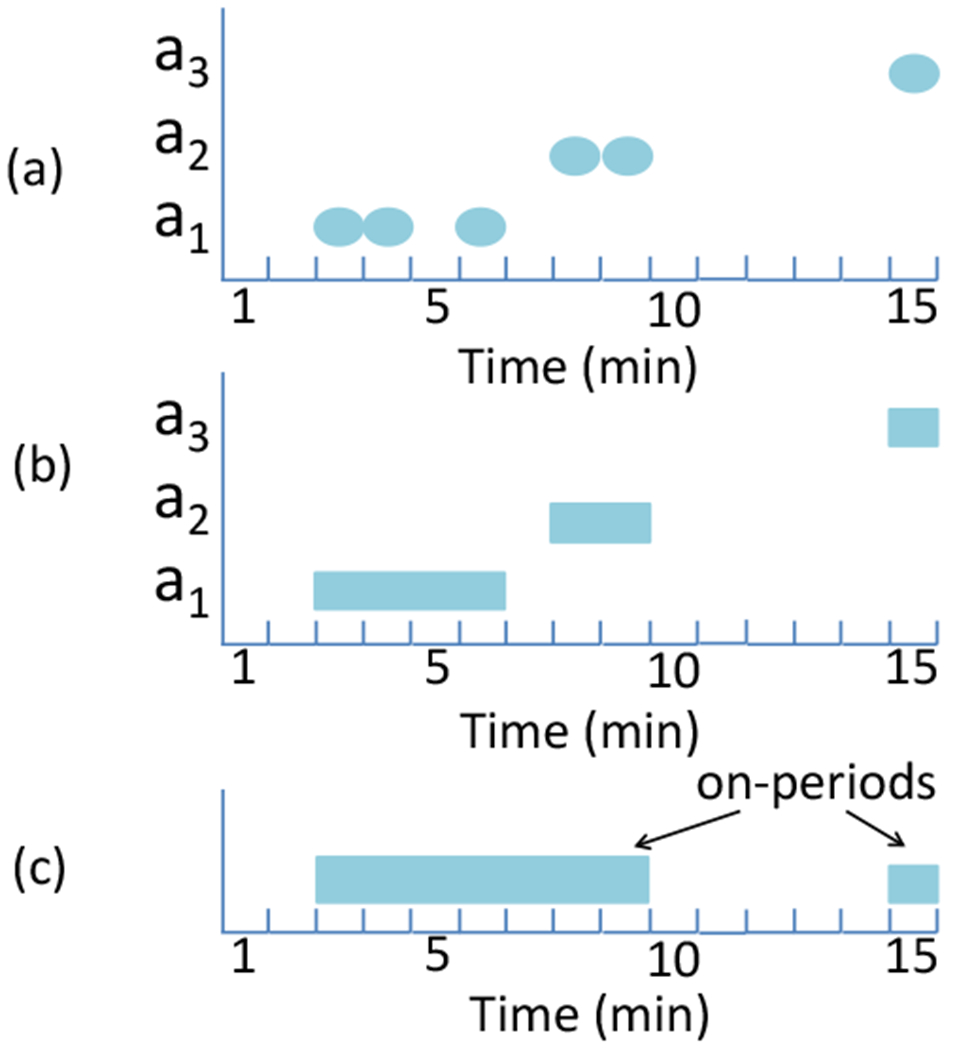
Fig. 2:

Illustration of identifying on-off periods. (a) Per-minute traffic for each of the three external IP addresses (an oval marks the presence of traffic in that minute). (b) Aggregation for each IP address. (c) Aggregation over the IP addresses.
