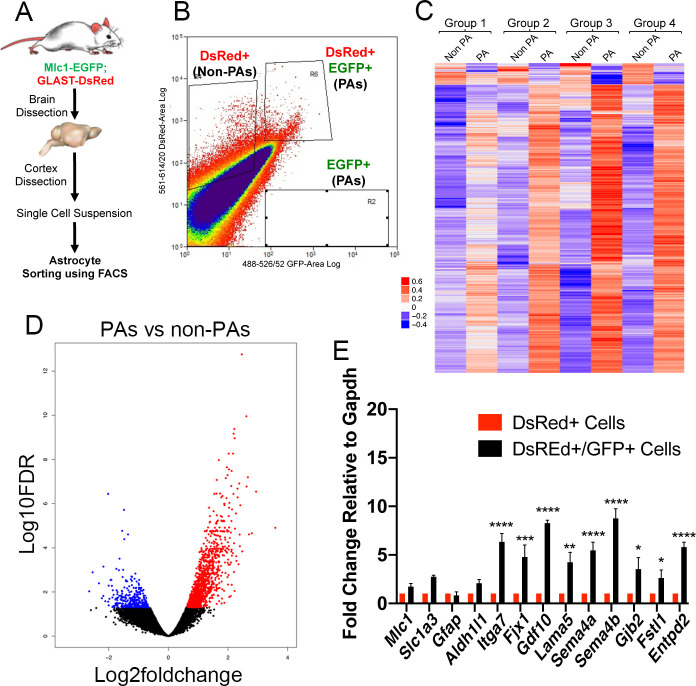
Fig 5. Quantitative RNA sequencing to identify differentially expressed genes in PAs versus non-PAs isolated from Mlc1-EGFP;GLAST-DsRed adult mice.
(A); Strategy for dissection and analysis of cells from cerebral cortices of Mlc1-EGFP;GLAST-DsRed adult mice. Non-PAs (DsRed+ cells) and PAs (EGFP+/DsRed+ cells) were fractionated using FAC-based sorting approaches followed by comparative RNA sequencing. (B); Flow cytometry plot showing the profile of sorted DsRed+ single positive cells (non-PAs) and EGFP+/DsRed+ double positive cells (PAs) from the cerebral cortices. Note that the majority of cells are DsRed+ and nearly all EGFP+ cells are double positive for DsRed. The few cells in the lower box are EGFP+ single positive PAs that lack DsRed expression. (C, D); Quantitative RNA sequencing comparisons reveal differentially expressed genes in PAs versus non-PAs as revealed by a color-coded heat map (C) and a volcano plot (D). Red indicates higher mRNA expression levels and blue indicates lower expression in PAs versus non-PAs. Differentially expressed genes were identified using the EdgeR package with adjusted p-value cutoffs <0.05 and log2 fold changes > 2. (E) Independent validation of differential gene expression using mRNA isolated from PAs (EGFP+/DsRed+) and non-PAs (EGFP-/DsRed+). Note that the select genes analyzed show enrichment in PAs as compared to non-PAs, as revealed by qRT-PCR. Error bars indicate SE of the mean, n = 3. The red bars indicate EGFP-/DsRed+ cell fractions. Expression differences between sorted cells were determined using two-way analysis of variance with Bonferroni post-hoc test, *p<0.05, **p<0.01, ***p<0.001, and ****p<0.0001.

