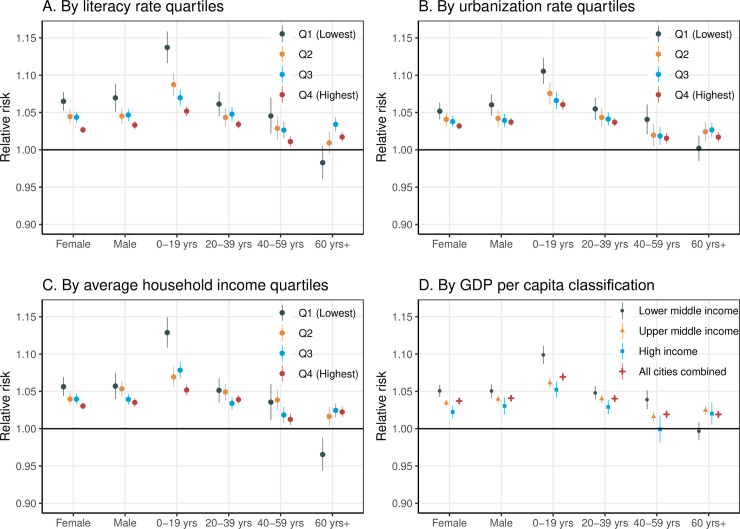
Fig 3. The association between heat exposure (for every 5°C increase in daily mean temperature) and hospitalization during lag 0–7 days, stratified by socioeconomic level, sex, and age group.
Literacy rate (A), urbanization rate (B), household income (C), and GDP per capita (D). Q1–Q4 represent 4 quartiles from the lowest to the highest. GDP per capita classifications were based on the World Bank’s 2015 standard. CI, confidence interval; GDP, gross domestic product.

