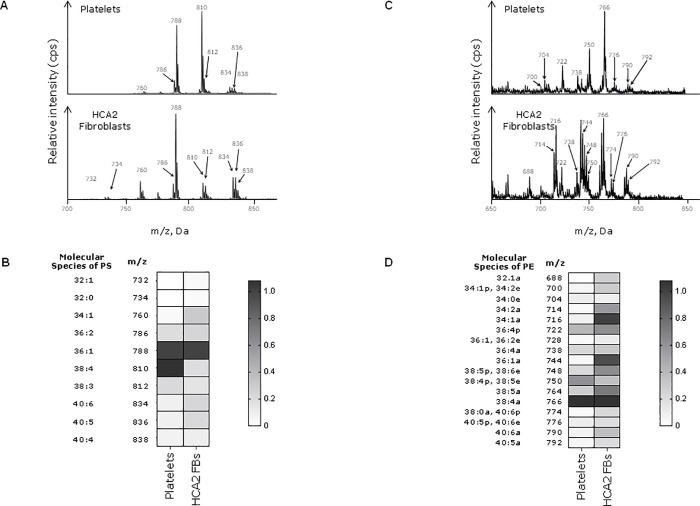
Fig 1. PS/PE species in platelets and fibroblasts.
Lipids were extracted from 106 unstimulated fibroblasts and 2 x 10⁸ freshly-isolated human platelets. PS/PE precursor scans were run using a QTRAP 6500 LC-MS/MS system as specified in materials and methods. Data are representative of three independent experiments. A) Mass spectra of PS species showing the mass-to-charge ratio (m/z) and the relative intensity (cps) of each species. B) PS intensity values from the spectra represented on the Heatmap. C) Mass spectra of PE species. D) Heat map representing PE intensity values. Molecular species refers to the total number of carbon atoms and double bonds in the two fatty acid chains of the phospholipid.

