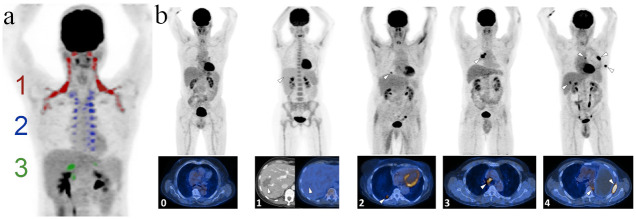
Fig 2. 2a: Coronal FDG-PET projection showing the anatomical locations of the BAT depots (color coded: 1 = supraclavicular/cervical, 2 = thoracic, 3 = infradiaphragmatic/abdominal activation).
BAT in humans is strictly activated in a craniocaudal fashion, i.e. the more caudally activated depots indicate higher overall glycolysis and can hence be categorically graded in this way. 2b: Representative examples of patients suffering from different grades of cancer burden. Grades were assigned as follows: 0 = No visible signs of cancer, 1 = cancer visible in CT, but metabolically inactive in FDG-PET, 2 = single lesion, 3 = local metastases, 4 = distant metastases. Top row: Maximum intensity projections of the FDG-PET data (dark = high FDG uptake), bottom row: fused PET/CT slices through representative locations (yellow = high FDG-uptake). Index lesions are marked with white arrow tips.

