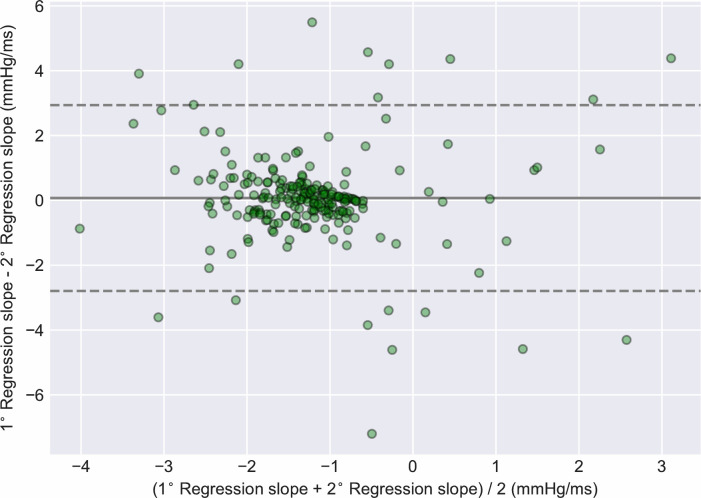
Fig 6. Bland-Altman plot of regression slopes for primary vs. secondary segments.
The mean value of the regression slope for two segments from the same subject is displayed on the x-axis. The bias, i.e. the difference between the regression slopes of the two segments, is displayed on the y-axis (n = 215).

