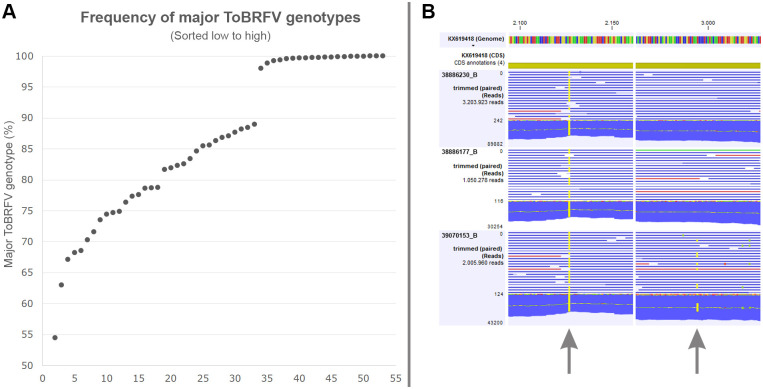
Fig 3. Within sample diversity of ToBRFV genotypes.
A. Frequency (y-axis) of major ToBRFV genotypes in datasets (x-axis) generated in this study. Within sample frequencies of major genotypes are sorted low to high. B. Detail of RNAseq read mappings to the small replicase subunit of KX619418 for ToBRFV samples 38886230_B, 38886177_B, and 39070153_B. For each sample the total number of mapped reads is shown as well as the maximum read coverage. The left SNP (arrow) represents a single genotype (>99.7%) that is present in all three samples. The right SNP reveals the presence of a minor genotype (32.8%) in sample 39070153_B.

